Validation of the Short Form of the Mood Instability Questionnaire-Trait (MIQ-T-SF) in the Korean General Population
Article information

Abstract
Objective
Mood instability (MI) is a clinically significant trait associated with psychiatric disorders. However, there are no concise measurements to evaluate MI. The initial Mood Instability Questionnaire-Trait (MIQ-T) was developed to fill this gap. The current study aimed to create a short form of MIQ-T (MIQ-T-SF) that measures MI with high validity and reliability in the Korean general population.
Methods
Of the 59 items in the MIQ-T, 17 items were chosen for the MIQ-T-SF following the factor analysis process. In total, 540 participants completed the MIQ-T-SF. Cronbach’s alpha and McDonald’s omega were used to evaluate reliability. Exploratory factor analysis (EFA) and confirmatory factor analysis (CFA) were used to determine construct validity. Concurrent validity was confirmed via comparisons with Personality Assessment Inventory-Borderline Features Scale. Measurement invariance across gender and age groups was confirmed before analyzing differences in scores using Kruskal-Wallis test.
Results
The MIQ-T-SF displayed expected correlations and high internal consistency (α=0.71–0.90, Ωt=0.72–0.92). Using EFA and CFA, a five-factor structure was confirmed. Measurement invariance was supported, and gender differences were observed.
Conclusion
The MIQ-T-SF is an accurate and reliable method to detect MI in the Korean general population. The study’s results offer new perspectives for future studies on MI.
INTRODUCTION
Mood instability (MI), generally defined as experiencing “rapid oscillations of intense affect, with a difficulty in regulating these oscillations or their behavioral consequences,” is common and known to be associated with various psychiatric illnesses [1,2]. MI has been demonstrated to be associated with mood disorders and is an important risk factor and precursor for both depressive and bipolar disorders [3,4]. MI is also associated with prominent features of psychosis and can be used to predict the later emergence of paranoid ideation and auditory hallucinations [5]. Additionally, although MI is not included as a diagnostic criterion for attention-deficit hyperactivity disorder (ADHD) in the Diagnostic and Statistical Manual of Mental Disorders (5th edition), research suggests that MI and ADHD symptoms may be linked, with overlapping cognitive and neural correlates [6]. Overall, MI is a clinically significant trait that occurs commonly in various mental illnesses and is associated with poor long-term clinical and functional outcomes [7,8]. In addition to showing associations with the illness course, treatment, and prognosis of psychiatric disorders, MI is also known to be associated with cognitive and social outcomes. As one’s mood influences all cognitive functions [9], MI can impact an individual’s academic performance [10], occupational functioning [8], and social skills [8,11].
As shown by its definition, MI encompasses various features such as frequency and rapidity of mood shifts, intensity of affect, ability to regulate, and reactivity to the environment [1]. Although the importance of MI in both general and clinical settings has been recognized, there is a lack of comprehensive assessments to measure all aspects of MI [1]. In this context, the Mood Instability Questionnaire-Trait (MIQ-T) was developed by Yoon et al. [12]. Briefly, the MIQ-T is a 59-item self-report questionnaire that assesses the trait of MI using the five factors of Lability, Upward Tendency, Downward Tendency, Childhood Instability, and Seasonality. The Lability factor includes items regarding an individual’s overall shifts in affect, energy, cognition, and interpersonal behavior. The Upward Tendency factor measures an individual’s tendency to feel euphoric, excited, and energized, while the Downward Tendency factor focuses on the proneness of an individual to experience negative and unstable emotions such as depression, anxiety, and irritability. The Childhood Instability factor includes retrospective items about one’s mood during childhood, whereas the Seasonality factor evaluates how strongly the seasonal changes affect an individual’s mood, energy, and behavior. The original MIQ-T has demonstrated good internal consistency and construct validity, showing correlations with previously validated scales and questionnaires that aligned with the authors’ expectations. Concurrent validity was established using temperament and personality scales that include the concept of MI, such as the Personality Assessment Inventory-Borderline Features Scale (PAI-BOR). Moreover, significant differences in mean MIQ-T scores among the comparison group and patient groups (major depressive disorder, bipolar I disorder, and bipolar II disorder) were observed, showing promise for the use of MIQ-T in aiding the differential diagnosis of mood disorders and informing clinical decisions regarding medication use and treatment course.
The present study had two goals. First, we sought to develop a short form of the MIQ-T (MIQ-T-SF) that included all five original factors and to examine its reliability and validity. The development of the MIQ-T-SF is warranted, as the original MIQ-T questionnaire has a total of 59 items, which results in a long administration time, reducing the approachability of the measure. Although two versions of a short form were created as part of the original MIQ-T development study that was conducted in a clinical sample of patients with mood disorders [12], these short forms did not include the Seasonality factor as the statistical processes at the time prioritized items with the highest loadings on the exploratory factor analysis (EFA). However, as seasonal changes in mood and behavior can be seen in both the general population [13,14] and in psychiatric patients without a diagnosis of seasonal affective disorder [15,16], seasonality appears to be an important dimension within MI and, thus, should be included in the short form. Second, we aimed to compare the MIQ-T-SF scores with regard to gender and age groups in the general population, to better understand its utility and applicability. While the original development of the MIQ-T was focused more on its application in psychiatric settings, the MIQ-T-SF is aimed to be utilized in various other settings such as schools or medical primary care to evaluate one’s trait of MI and provide appropriate resources. Therefore, the usefulness of the MIQ-T-SF should be validated in the general population to clarify the fundamental impact of MI on people’s thoughts and behaviors.
METHODS
Study design and participants
This cross-sectional study included 540 healthy participants from the Korean general population, who were recruited in equal parts by gender and age group via an online survey in July 2021. Participants who self-reported a history of psychiatric diagnosis were excluded from the study. The sample included 270 men and 270 women aged 19–60 years. All participants in the current study were informed about the purpose of the study prior to their participation. The present study was approved by the Institutional Review Board of Seoul National University Bundang Hospital (protocol code X-2107-696-903, approved July 1, 2021). As the researchers did not have direct access to the participants’ personal information, the requirement for informed consent was waived, and anonymized survey data were used for analysis.
Measures
The full MIQ-T questionnaire, consisting of 59 questions, was used to assess the trait of MI with a five-factor structure: Lability, Downward Tendency, Upward Tendency, Seasonality, and Childhood Instability. All MIQ-T items were scored on a 4-point Likert scale: “exactly true=3,” “moderately true=2,” “hardly true=1,” and “not at all true=0.” MIQ-T scores are calculated by summing item scores in each subscale. As previously explained, two short forms were created as part of the original MIQ-T development study [12]; however, these short forms did not include the Seasonality factor. As Seasonality is a highly relevant feature of MI, a new MIQ-T-SF that included all five original factors was needed. As such, an EFA was performed on the 15-item short form of the MIQ-T that was previously developed and three questions of Seasonality. According to the EFA, one item with a low factor loading was excluded and 17 items were selected for the MIQ-T-SF.
Temperament and personality were assessed using the Temperament Evaluation of Memphis, Pisa, Paris, and San Diego Autoquestionnaire (TEMPS-A) and PAI-BOR scales. The TEMPS-A, which includes cyclothymic, depressive, hyperthymic, irritable, and anxious subscales, evaluates an individual’s affective temperament [17]. TEMPS-A uses a dichotomous scoring system, with “yes=1” and “no=0.” TEMPS-A subscale scores were calculated by averaging the item scores in each subscale. Similarly, the PAI-BOR is a subscale of the PAI that focuses on mood lability and intense mood states, with affective instability being one of the core factors [18]. Other PAI-BOR factors are identity problems, negative relationships, and self-harm [18]. The PAI-BOR is scored on a Likert scale, ranging from “never true=1” to “very true= 4.” The PAI-BOR score was calculated by summing all item scores. The TEMPS-A and PAI-BOR scales were used for external validation.
Statistical analysis
Principal component analysis with direct oblimin rotation was performed for EFA. Horn’s parallel analysis was used to determine the number of factors to be extracted from the MIQ-T-SF. A confirmatory factor analysis (CFA) was also carried out to confirm the factor structure of MIQ-T-SF. Model fit was evaluated using the chi-squared test (χ2), root mean squared error of approximation (RMSEA), Tucker-Lewis index (TLI), and comparative fit index (CFI) based on the conventional guidelines set by Hu and Bentler [19]. TLI, CFI >0.95, RMSEA <0.06 values were considered evidence of a well-fitting model [19]. Cronbach’s alpha and McDonald’s omega were used to assess the internal consistency of the MIQ-T-SF. The scores for each subscale in the MIQ-T-SF were calculated as the sum of the subscale item scores. The normality of the distribution of the analyzed variables was assessed using the Shapiro-Wilk analysis. As the parameters did not follow a normal distribution, non-parametric analyses were performed in correlation tests among the subscales and for concurrent validity with the TEMPS-A and PAI-BOR (Spearman’s correlation test), as well as in tests used to compare scores between gender and age groups (Kruskal-Wallis analysis). Multi-group CFA was used to evaluate measurement invariance in order to confirm that MIQ-T-SF was assessing the same construct across gender and age groups. We examined the evidence for configural invariance (equality of factor structures), metric invariance (equality of factor loadings), and scalar invariance (equality of item intercepts). For configural invariance, the goodness-of-fit was evaluated using similar guidelines as the CFA: CFI >0.95, RMSEA <0.06. For metric and scalar invariance, the variance of CFI and RMSEA (ΔCFI, ΔRMSEA) were used as indices. ΔCFI <0.01 and ΔRMSEA <0.015 were considered acceptable values as evidence of invariance [20,21]. R 3.5.1 (R Foundation for Statistical Computing, Vienna, Austria; https://cran.r-project.org/bin/windows/base/old/3.5.1/) software was used for all statistical analyses.
RESULTS
Clinical and demographic characteristics
The participants in this study were evenly divided by age and gender. The age groups were divided in terms of decades, ranging from the 20’s group (aged 19–29 years), the 30’s group (aged 30–39 years), the 40’s group (aged 40–49 years), to the 50’s group (aged 50–60 years). Table 1 shows the additional clinical and demographic characteristics, and descriptive statistics for psychological assessment scores.

Clinical and demographic characteristics of participants (N=540)
EFA
The Kaiser-Meyer-Olkin (KMO) and Bartlett’s tests were used to ensure that the data were suitable for EFA. The KMO value of 0.90 and Bartlett’s test of sphericity at the p<0.001 level confirmed that the data were suitable for EFA. We assumed that the 18 items of the MIQ-T-SF were correlated. Thus, the EFA was performed with direct oblimin (oblique) rotation. Table 2 presents the results of the EFA. The items included in the EFA were the previously developed 15-item short form of the MIQ-T and three items of Seasonality. Items with factor loadings higher than 0.4 were grouped, which resulted in the elimination of one item from the Lability subscale (“When I have a lot of free time, my moods become unstable.”). The remaining 17 items comprised the five factors (Lability: five items, Downward Tendency: three items, Upward Tendency: three items, Seasonality: three items, and Childhood Instability: three items). Through parallel analysis, it was ensured that the five-factor structure obtained was appropriate (Supplementary Figure 1 in the online-only Data Supplement). The five-factor model explained 57.90% of the total variance.

Exploratory factor analysis with direct oblimin rotation and the factor structure of MIQ-T-SF in participants (N=540) (items in English)
CFA
The CFA was conducted with the five-factor model extracted as a result of EFA. The results of CFA showed a good fit to the model according to all appropriate indices (χ2=74.81; degrees of freedom=109; p>0.05; RMSEA=0.038; RMSEA 95% confidence interval=0.030–0.047; TLI=0.952; CFI=0.961). As the χ2 is heavily influenced by sample size [22], it is reported here only for completeness of data.
Reliability analysis and correlations within the MIQ-T-SF scales
Supplementary Table 1 (in the online-only Data Supplement) shows the Cronbach’s alpha and McDonald’s omega coefficients for each factor and the complete MIQ-T-SF. Lability (α=0.88, Ωt=0.90), Downward Tendency (α=0.86, Ωt=0.86), Upward Tendency (α=0.71, Ωt=0.72), Seasonality (α=0.83, Ωt=0.84), and Childhood Instability (α=0.85, Ωt=0.85), all had a reliability coefficient of 0.7 or higher. The complete MIQ-T-SF showed a Cronbach’s alpha value of 0.90 and McDonald’s omega value of 0.92, indicating excellent internal consistency.
The results of the correlation analyses of the subscales are presented in Table 3. All correlations among the subscales were significant and positive (p<0.001). In particular, Lability and Downward Tendency showed the highest correlation (r=0.61, p<0.001). In addition, Lability was positively correlated with Upward Tendency (r=0.23, p<0.001), Seasonality (r=0.38, p<0.001), and Childhood Instability (r=0.51, p<0.001). Downward Tendency was positively correlated with Upward Tendency (r=0.42, p<0.001), Seasonality (r=0.32, p<0.001), and Childhood Instability (r=0.39, p<0.001). Upward Tendency was positively correlated with Seasonality (r=0.24, p<0.001) and Childhood Instability (r=0.17, p<0.001). Seasonality was positively correlated with Childhood Instability (r=0.25, p<0.001). These results indicate that the subscales are interrelated and that they represent distinct but related dimensions of MI.
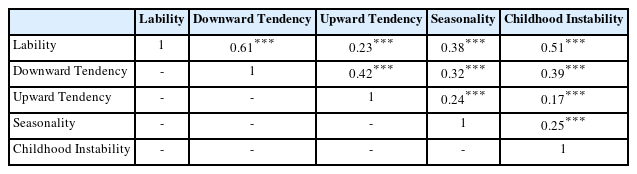
Correlations between the subscales of MIQ-T-SF
Construct validity
The results of the correlation analysis between the MIQ-TSF and MIQ-T subscales are presented in Table 4. All subscales of MIQ-T-SF and MIQ-T were positively correlated with each other, but these correlations were particularly strong between corresponding subscales of the MIQ-T-SF and MIQ-T. The highest correlation between corresponding subscales was demonstrated by Childhood Instability (r=0.95, p<0.001), followed by Lability (r=0.89, p<0.001), Upward Tendency (r=0.87, p<0.001), and Downward Tendency (r=0.84, p<0.001). The MIQ-T and MIQ-T-SF used the same items to assess the subscale of Seasonality, hence showing a correlation value of 1. In addition, the MIQ-T-SF and MIQ-T total scores showed a very strong, positive correlation (r=0.93, p<0.001).

MIQ-T-SF factors’ correlations with MIQ-T factors
Regarding external validation via other temperament and personality scales, the MIQ-T-SF total score was positively correlated with the cyclothymic (r=0.69), depressive (r=0.44), irritable (r=0.59), and anxious (r=0.64) temperament subscales of the TEMPS-A, but was negatively correlated with the hyperthymic (r=-0.18) temperament subscale (Table 5). The MIQ-T-SF total score was also positively correlated with the PAI-BOR subscales: PAI-BOR total score (r=0.56), Affective Instability (r=0.61), Identity Problems (r=0.51), Negative Relationships (r=0.44), and Self Harm (r=0.32). MIQ-T-SF subscales also demonstrated significant correlations with PAI-BOR subscales, and only Upward Tendency (from MIQ-T-SF) and Self Harm (from PAI-BOR) showed no significant correlation (Table 5).

MIQ-T-SF correlations with other questionnaires: TEMPS-A, PAI-BOR
Measurement and structural invariance
Table 6 presents the results for the measurement invariance models by gender and age groups. With CFI value >0.95 and RMSEA <0.06, the configural invariance across gender and age groups were accepted, which indicate that the items of MIQT-SF load on the same factors across groups. Then we assessed metric invariance by constraining factor loadings to be equivalent in the groups. As shown in Table 6, both metric invariance models for gender and age groups were deemed acceptable. Both models satisfied the conditions of ΔCFI ≤0.01 and ΔRMSEA ≤0.015, suggesting adequate metric invariance. These findings imply that each item contributed to the latent factors in a similar degree across groups, which is indicated by the fact that the item loadings for the five factors are equal across groups. As metric invariance was also supported, we investigated scalar invariance by constraining the item intercepts to be equivalent across groups, along with the constraints in factor loadings of the metric invariance model. Both models for gender and age groups showed acceptable fit indices (ΔCFI ≤0.01, ΔRMSEA ≤0.015) and indicated that scalar invariance was also established. These findings suggest that mean differences in latent factors capture all mean differences in the shared variance of the items and that comparing means across gender and age groups can be justified.

Summary of measurement invariance analysis
Group differences in MIQ-T-SF scores
The Kruskal-Wallis test showed significant differences in MIQ-T-SF scores by gender (male and female) but not by age groups (20’s, 30’s, 40’s, and 50’s). Particularly, there were significant differences between males and females across four factors of the MIQ-T-SF. Women had significantly higher Lability (p<0.001), Downward Tendency (p<0.001), Upward Tendency (p<0.001), and Seasonality (p<0.05) scores than did men. The score of Childhood Instability did not differ according to gender. In contrast, the MIQ-T-SF factors showed no significant differences among the age groups. Supplementary Figure 2 (in the online-only Data Supplement) displays the results of specific post-hoc comparisons using Dunn’s test. Supplementary Table 2 (in the online-only Data Supplement) shows the mean and standard deviation of the MIQ-T-SF scores between genders.
DISCUSSION
The present study developed a MIQ-T-SF that demonstrated the same factorial structure as the original MIQ-T and evaluated its reliability and validity. The EFA conducted via principal component analysis using direct oblimin rotation resulted in a 17-item MIQ-T-SF and found a five-factor structure, which is the same as that of the MIQ-T. The CFA results confirmed this five-factor structure. Importantly, the MIQ-T-SF also demonstrated great internal consistency for each factor and the complete questionnaire via Cronbach’s alpha and Mcdonald’s omega coefficients. As expected, the five factors demonstrated significant positive correlations with each other, the most pronounced being between Lability and Downward Tendency. However, as these correlations were moderate at most (i.e., r<0.7), we can conclude that these factors are independent but related features of the MI trait. In addition, correlations between the corresponding factors and the total scores of MIQ-T-SF and MIQ-T were found to be excellent, supporting the construct validity of the short form. Overall, these findings demonstrate that the MIQ-T-SF is a reliable and valid scale that encompasses and assesses the various features of MI.
All original factors of the MIQ-T were maintained in the MIQ-T-SF. The MIQ-T-SF is a 17-item self-report questionnaire with five factors: Lability (five items), Downward Tendency (three items), Upward Tendency (three items), Childhood Instability (three items), and Seasonality (three items). The five-factor structure of the MIQ-T-SF mirrors that of the MIQ-T and is consistent with previous literature [1,2,12]. Although the original MIQ-T was developed in a clinical psychiatric population, the MIQ-T-SF still proved to be a good fit for the data in the general population as shown via a CFA. Apart from the chi-square test (which is easily influenced by sample size), all goodness-of-fit indices demonstrated that the five-factor structure was acceptable. Regarding reliability, the MIQ-T-SF demonstrated high internal consistency values for each factor and the complete questionnaire. All five factors of the MIQ-T-SF were positively correlated with each other. However, since these correlations did not exceed a threshold of 0.7, which is the criterion for a strong correlation [23], the five factors can be regarded as independent yet interrelated dimensions within a single trait of MI.
The construct validity of the MIQ-T-SF was examined via correlation analyses using the original MIQ-T scores and other clinically relevant scales. All factors of the MIQ-T-SF showed strong, positive correlations with the corresponding factors of the MIQ-T, indicating a stable factorial structure and conceptual unity with the MIQ-T. In addition, the total MIQ-T-SF score exhibited excellent positive correlation with the total MIQ-T score, demonstrating that the MIQ-T-SF is a valid and effective alternative to the MIQ-T. Correlations between the MIQ-T-SF and other clinically relevant scales generally mirrored correlations observed when using the full MIQ-T. Compared to the TEMPS-A, which includes several temperamental types as subscales, we expected moderate to strong, positive correlations with all temperaments, except for the hyperthymic scale, as that was the case for the full MIQ-T. In addition, the cyclothymic, depressive, irritable, and anxious scales in the TEMPS-A represent negative affect and instability in mood, energy, and behavior, which is characteristically similar to the trait of MI. Thus, we expected the MIQ-T-SF to correlate with these subscales, and the results were consistent with our expectations. The MIQ-T-SF demonstrated moderate to strong, positive correlations with the cyclothymic, depressive, irritable, and anxious subscales in TEMPS-A while showing a weak, negative correlation with the hyperthymic subscale. Concurrent validity was also evaluated using PAIBOR, a scale within the PAI that assesses borderline personality symptoms. The characteristic symptoms of borderline personality disorder include mood lability, identity problems, and unstable interpersonal relationships, which are also associated with MI. Thus, the MIQ-T-SF total score demonstrated a moderate, positive correlation with the PAI-BOR total score. Among the PAI-BOR subscales, Affective Instability, which includes items similar to the Lability factor in the MIQ-T-SF, showed the strongest correlation with the MIQ-T-SF total score. Other MIQ-T-SF and PAI-BOR subscales were also significantly correlated, with the exception of Upward Tendency and Self Harm. Consistent with previous research, MIQ-T-SF scores correlated significantly with measures of temperament types and borderline personality, which are associated with the concept of MI.
In accordance with the second aim, we examined the differences in MIQ-T-SF scores between genders and age groups. Before comparing across groups, we confirmed the measurement and structural invariance of the MIQ-T-SF by conducting a multi-group CFA. All models (configural invariance, metric invariance, and scalar invariance) were deemed acceptable, indicating that the same construct was measured across gender and age groups. The Kruskal-Wallis analysis revealed significant score differences for all factors between genders, except for Childhood Instability: females scored higher than males on Lability, Downward Tendency, Upward Tendency, and Seasonality than did males. This finding is somewhat consistent with previous literature, as many studies have found that females scored higher than males on the dimensions of MI. With respect to TEMPS-A, females usually score higher on the depressive, cyclothymic, irritable, and anxious subscales (i.e., dimensions of negative affect) while males usually score higher on the hyperthymic temperament subscale (i.e., a more positive construct of being full of energy and having an optimistic disposition) [24-26]. Interestingly, Kang et al. [27] showed that in healthy Korean participants, females scored higher on all temperaments than did males, which is similar to the results of the present study: the cyclothymic temperament resembles items in Lability; depressive, irritable, and anxious temperaments include concepts of Downward Tendency; and items within the hyperthymic temperament is similar to those of Upward Tendency. In addition, mood instability is more likely to be reported by females than males in the general adult population, as well as the clinical adult population in England [7,28]. Moreover, previous research suggests females experience greater seasonal variations in mood and behavior, even in the general population [14,29], which supports our finding. Regarding scores for Childhood Instability, although many studies show that girls experience greater mood instability than do boys [30], there were no gender differences observed in our results. One explanation may be that children in Korea, regardless of gender, are more likely to suppress their emotions in comparison to children in European or North American countries, as Korea has a collectivist culture in which individuals value social harmony than emotional expression [31]. Meanwhile, no score differences were observed across age groups, demonstrating the efficiency and utility of the MIQ-T-SF for measuring mood instability in participants across a wide age range.
Despite the meaningful results, the current study must be interpreted within the context of its design and related limitations. First, as the MIQ-T was originally developed and validated in the Korean population, the MIQ-T-SF was also developed in Korea and involved the Korean general population. As the MI trait may differ across different ethnicities and countries, future research with samples from different ethnic populations is warranted. Translations to other languages (English, Japanese, French, German, Spanish, and Mandarin) are provided in Supplementary Table 3 (in the online-only Data Supplement). Second, because we utilized an online survey platform to recruit participants and collect anonymized data, we could not confirm the absence of psychiatric diagnoses in our sample. Individuals with a history of current or past psychiatric illness may experience more MI than do individuals without such history, which may have inflated certain scores. Nonetheless, the assumption of the MIQ-T-SF is that it includes dimensions within a single trait of MI, and thus, individuals who experience MI will score higher than others on all factors. In addition, the online survey included a screening question regarding the psychiatric history of participants, which would have helped exclude individuals with such a history. Third, due to the anonymized data, test-retest reliability could not be investigated. As an important component of scale validation, this is an area for improvement for future studies. Fourth, as the Childhood Instability factor includes items of a retrospective nature, concerns about accuracy could be raised. However, as these items do not ask about specific recollections, and instead ask participants to broadly recall their own behavior over the course of their childhood, the authors believe that the issue of accuracy is not a big concern. Lastly, the MIQ-T-SF should be investigated in both the patient population and the general, nonpsychiatric population to evaluate its utility in differentiating between the two groups. The MIQ-T had demonstrated its potential in differentiating between diagnosis groups and between the psychiatric and nonpsychiatric samples in the initial development study [12]. It would be worthwhile to assess whether the MIQ-T-SF can also be used to compare scores between patients and controls, which would make it useful in symptom detection, differential diagnosis, and monitoring treatment efficacy. Future studies that address the current limitations and further explore the utility of the MIQ-T-SF are needed.
Despite these limitations, the present study also has some advantages over the original MIQ-T development study. In the original study, items were selected from various, pre-existing questionnaires to develop the MIQ-T and, thus, there was a separate scoring system for specific items. However, the present study used a uniform answering scale from “not at all true=0” to “exactly true=3,” improving the utility of the MIQ-T-SF. As the MIQ-T and MIQ-T-SF exhibit similarities in factorial structure and correlations with other established scales, we believe that the use of a uniform answering scale can be validated. Moreover, the sample was recruited in equal parts by gender and age groups. Given that our sample was balanced, the results can be easily generalized to other Korean individuals, and comparisons between gender and age groups can be considered reliable.
In conclusion, this study presents several important findings. We aimed to develop a MIQ-T-SF while maintaining the five-factor structure and to achieve comparable psychometric properties and construct validity of the full version. Overall, the results provide additional support for the MIQ-T scale, confirming the conceptual unity of the MIQ-T-SF with the MIQ-T, and validating the utility of the shorter version. The MIQ-T-SF appears to be a promising measure that captures the dimensions related to MI and offers a coherent invariant factor structure that is similar to that of the original MIQ-T. The current results indicate that the MIQ-T-SF can reliably and validly assess the MI trait using 17 items, thus improving its efficiency and demonstrating its usefulness as an economical alternative to the full MIQ-T. The brevity of the MIQ-T-SF allows for less item redundancy, less respondent burden, simplified scoring, and shorter administration time in assessments of both the clinical and general populations. The MIQ-T-SF can contribute to both clinical and research procedures as it can be used in time- and cost-intensive research to quickly assess MI and to monitor the treatment progress and symptom reduction in clinical individuals with MI. Various translations are provided in Supplementary Table 3 (in the online-only Data Supplement) for accessibility of the MIQ-T-SF.
Supplementary Materials
The online-only Data Supplement is available with this article at https://doi.org/10.30773/pi.2022.0275.
Reliability analysis results based on the Cronbach’s alpha and McDonald’s omega coefficients
Mean and standard deviation of MIQ-T-SF scores between genders
Various translations of the MIQ-T-SF (17 items)
Results of parallel analysis on the MIQ-T-SF. Adjusted Eigenvalues >0 indicate dimensions to retain (five factors retained). EV, Eigenvalues; MIQ-T-SF, short form of the Mood Instability Questionnaire-Trait (MIQ-T-SF).
Violin plots showing the distribution of the five factor scores according to age or gender. a: p-value of Kruskal- Wallis analysis, b: upper adjacent value, c: third quartile (75%ile), d: median, e: first quartile (25%ile), f: lower adjacent value. *p<0.05; ***p<0.001.
Notes
Availability of Data and Material
The datasets generated or analyzed during the study are available from the corresponding author on reasonable request.
Conflicts of Interest
The authors have no potential conflicts of interest to disclose.
Author Contributions
Conceptualization: Joohyun Yoon, Hyeona Yu, Tae Hyon Ha, Woojae Myung. Data curation: Joohyun Yoon, Hyeona Yu, Yoonjeong Jang, Yun Seong Park, Hyun A Ryoo, Nayoung Cho. Funding acquisition: Woojae Myung. Investigation: Joohyun Yoon, Hyeona Yu, Yoonjeong Jang, Daseul Lee, Yun Seong Park, Hong Kyu Ihm, Hyun A Ryoo, Nayoung Cho, Jakyung Lee, Yeoju Kim, Hyo Shin Kang, Tae Hyon Ha, Woojae Myung. Supervision: Hyo Shin Kang, Tae Hyon Ha, Woojae Myung. Writing—original draft: Joohyun Yoon, Hyeona Yu. Writing—review & editing: all authors.
Funding Statement
This work was supported by a National Research Foundation (NRF) of Korea Grant, funded by the Korean government (NRF-2021R1A2C4001779; WM). This research was additionally supported by the Korea Medical Device Development Fund grant, funded by the Korean government (the Ministry of Science and ICT; the Ministry of Trade, Industry and Energy; the Ministry of Health & Welfare; the Ministry of Food and Drug Safety) (Project Number NTIS 9991006915, KMDF_PR_20200901_0250). The funding body had no role in the study design, data collection, data analysis, data interpretation, or writing of the report. The corresponding author has full access to all the data in the study and has final responsibility for the decision to submit for publication.
Acknowledgements
We appreciate the assistance in French translation provided by Dr. Nara Lee, Dong-eui University, Cinema and Transmedia Institute. We also acknowledge Dr. Kimyoung Kim of the Freie Universität Berlin’s Institut für Philosophie for his help in German translation. Other languages were translated by bilingual scholars who wished to remain anonymous.