


INTRODUCTION
Schizophrenia is a chronic, debilitating mental disorder that poses a severe health care burden [1] and is characterized by hallucination, delusion, and disorganized behavior. While much research has been conducted on schizophrenia, the pathophysiology of the disease remains unclear, particularly due to the heterogeneity and complexity of the disease itself. Although the possibility of structural alterations in the brain with schizophrenia had already been suggested [2], it was difficult to investigate these alterations due to the limitation of non-invasive in vivo investigation method until the rise of various neuroimaging techniques.
In this regard, diffusion tensor imaging (DTI) [3-5] has enabled the investigation of neuronal microstructures in vivo by quantifying the diffusion of water molecules. According to the Brownian motion theory, the diffusion of water molecules is isotropic. However, in the brain, the motion of water molecules is anisotropic due to cellular microstructures and may also be altered following microstructural changes. As a result, subtle neuronal changes can be estimated by deriving tensors from diffusion-weighted images, the so-called DTI technique.
Since DTI allows delicate in vivo investigation of the brain, it has been extensively applied to study schizophrenia [6-8], including the recent international multisite collaboration called ENIGMA project [9]. A large number of studies have demonstrated altered diffusivity in the brain with schizophrenia, suggesting subtle damage to neuronal microstructures. Fractional anisotropy (FA) has been widely used in a number of studies ever since its introduction [10,11], and so is the mean diffusivity (MD) [12,13], which is often referred to as the trace (TR; ╬╗1+╬╗2+╬╗3;3*MD). In addition, a few studies have also separately estimated the diffusivity perpendicular to and along the principal diffusion direction, namely, radial diffusivity (RD) and axial diffusivity (AD) [9].
By measuring these diffusion indices, white matter abnormalities in the brain with schizophrenia have widely been reported across a large number of DTI studies. Multiple brain regions have been found to show abnormal diffusion properties, including the internal capsule [14], corpus callosum [15-17], cingulum [18-20], cerebellar peduncle [21], left inferior longitudinal fasciculi [22], and left superior temporal gyrus [23]. Although most DTI studies have investigated white matter abnormalities in the brain with schizophrenia, there has also been a considerable amount of research reporting abnormalities in the grey matter of the brain with schizophrenia. The entorhinal cortex [24], superior temporal gyrus [23], parahippocampal gyrus, insula, and the right anterior cingulate gyrus [25] show significant diffusion abnormalities.
As mentioned above, previous studies have identified alterations in a few anatomical structures of the brain with schizophrenia. However, investigating in parts of the brain, or in either white matter or gray matter can be insufficient to com prehensively describe the pathophysiology of schizophrenia. This perspective has given rise to hypotheses like the dysfunctional connectivity hypothesis [26-28], which suggests that the pathophysiology of schizophrenia involves dysfunctional connections between discrete brain regions, not abnormalities confined to a single anatomical region.
Therefore, in this study, we tried to simultaneously focus on multiple regions by counting how many anatomical regions in a single brain were identified as abnormal. Information regarding the number of abnormal brain regions can indicate the total burden of abnormal diffusivity in the brain. In other words, this study did not consider the severity of abnormalities in a single anatomical brain region, but it instead assessed the number of brain regions with abnormalities over a threshold, even modest. Also, since there have also been a few reports of altered diffusivities in grey matter of the brain with schizophrenia [23-25], we investigated both white matter and grey matter to comprehensively investigate the whole brain abnormalities of patients with schizophrenia. In fact, there have even been some studies even reporting the correlation between grey matter alterations and clinical symptoms in schizophrenia patients [29,30], indicating the importance of concurrently investigating both white and grey matter. To the best of our knowledge, there has been no previous brain imaging study based on this concept, although some studies have concurrently investigated multiple brain regions using voxel-based morphometry (VBM) or tract-based spatial statistics (TBSS).
Considering the evidence showing diffusion abnormalities in many different brain regions of patients with schizophrenia [6,7,11,31], it is a plausible assumption that multiple brain regions, not a single region, are more likely linked to the pathophysiology of schizophrenia. Subtle microstructural alterations in each brain region may together lead to the disease, as the genetic liability model [32] or the polygenic model [33] in genomewide association studies (GWAS). Thus, investigation of both white and grey matter of the brain with schizophrenia and determination of the number of regions affected by the disease can be an innovative approach in the field of DTI studies.
In this study, we hypothesized that the additive burden of altered neuronal microstructures, represented by the number of abnormal regions of interest (ROIs) with altered diffusivity, would be significantly different between patients with schizophrenia and healthy participants. Altered diffusivity was measured by each diffusion measure (FA, AD, RD, and TR). Furthermore, the correlation between abnormal number of ROIs and clinical symptoms or cognitive function was also investigated.
METHODS
Study population
In this study, we used public neuroimaging data from SchizConnect (http://schizconnect.org). In SchizConnect, we obtained publicly available datasets from the Center for Biomedical Research Excellence (COBRE) [34] project. This project obtained data in accordance with the Declaration of Helsinki and was approved by local Institutional Review Board committee. Written informed consent was obtained from all participants after verifying each participantŌĆÖs intellectual capacity to provide informed consent through completion of a questionnaire related to the study procedures. Since this study analyzed anonymized public data, it was exempted from approval by the Institutional Review Board of Asan Medical Center (2019-0088). All data had been already anonymized before access to protect participant privacy. Study subjects not eligible for further analyses were excluded by visually inspecting T1-weighted and diffusion-weighted images of all study subjects. Then, patients with schizoaffective disorder were again excluded to achieve diagnostic homogeneity in the patient group. The final studied dataset consisted of 57 patients with schizophrenia and 71 healthy participants.
Image acquisition
All images were acquired using a Siemens 3-Tesla MR scanner (Trio, Siemens Healthcare, Erlangen, Germany). High-resolution T1-weighted images were collected with a multi-echo MPRAGE sequence, according to the following parameters: echo time (TE)=1.64, 3.5, 5.36, 7.22, and 9.09 ms; repetition time (TR)=2.53 s; inversion time (TI)=1.2 s; flip angle=7┬░; number of excitations=1; slice thickness=1 mm; field of view=265 mm; and resolution=256├Ś256; Diffusion images were collected by a multiple-channel radiofrequency coil with GRAPPA(X2) and 30 gradient directions with b=800 s/mm2 according to the following parameters: TE=84 ms; TR=9000 ms; number of excitations=1; 72 slices with slice thickness=2 mm; field of view=256├Ś256 mm; and matrix=128├Ś128; The scan parameters are described in detail on the following link: (http://schizconnect.org/uploads/data_instruction/pdffile/2/COBRE_Scan_Information.pdf).
Image processing
For image processing and analysis, the tools from the FMRIB Software Library (FSL) [35] were applied. Diffusion-weighted images were corrected for motion and eddy current distortions with the affine transformation of all gradient volumes, with the first b=0 volume through the FMRIBŌĆÖs Linear Image Registration Tool (FLIRT) [36,37]. All brain images were again visually inspected to exclude inappropriate images that were not eligible for further analyses. Then, T1-weighted images were parcellated into discrete anatomical regions according to the Desikan-Killiany Atlas of FreeSurfer Version 6.0 [38]. These T1-weighted images were then registered into baseline diffusion-weighted images with a b-value of zero by using the nonlinear registration method from the Advanced Normalization Tools [39,40]. Anatomical ROIs on diffusion-weighted images were derived according to the parcellated labels by using Free-Surfer. Each ROI was considered as a separate region regardless of whether it was from white matter or from grey matter. The diffusion-weighted map for each diffusion measure was generated using Diffusion Tensor Fitting (DTIFit) from the FMRIB diffusion toolbox [41].
ŌĆ£AbnormalŌĆØ regions of interest
After verifying 161 ROIs on the diffusion-weighted map, the mean and standard deviation of each diffusion measure, namely, FA, AD, RD, and TR, were estimated in every single ROI in all study participants. Then, all mean values in every single ROI from each participant were normalized into Z-scores. To categorize ROIs as ŌĆ£abnormal,ŌĆØ we used a cutoff Z-score of 1.96 converted from a p-value of 0.05. Using this cutoff Z-score, we separately estimated the number of ROIs with Z-scores above +1.96 and the number of ROIs with Z-scores below -1.96 for each participant. All 161 ROIs are listed in the Supplementary Table 1 (in the online-only Data Supplement), and the mean and standard deviation of each diffusion measure in every ROI before normalization are listed in the Supplementary Table 2 (in the online-only Data Supplement).
Neurocognitive function and clinical symptoms
An extensive neurocognitive evaluation was performed for all participants in COBRE. Among numerous tests, we chose tests representing each specific domain of neurocognitive function. The Wechsler Abbreviated Scale of Intelligence (WASI) [42], which was linked to the well-known Wechsler Adult Intelligence Scale-Third Edition (WAIS-III) [43], was chosen as a standardized scale to briefly measure general intelligence. The Symbol Search subtest from WAIS-III was additionally chosen to specifically measure the processing speed. The FAS test, also known as the letter fluency test, in the Multilingual Aphasia Examination, 3rd Edition (MAE) [44] was selected to assess verbal fluency as well as cognitive productivity.
Meanwhile, the Mazes Test from the Neuropsychological Assessment Battery (NAB) [45] was selected as a sensitive measure of frontal lobe dysfunction, reflecting executive function, planning, and foresight through maze-tracing tasks. The Continuous Performance Test, Identical Pairs version (CPT-IP) [46] was applied to reliably measure attentional skills. Lastly, the Mayer-Salovey-Caruso Emotional Intelligence Test (MSCEIT) [47], a test designed to evaluate the ability to perceive, use, understand, and regulate emotions, was chosen to measure alterations of emotion and affect as well as social cognition. For all neurocognitive tests, t-scores were obtained from COBRE to adjust the effects of age and education level.
In addition, clinical symptoms were also widely evaluated for all participants. In this study, we chose the Positive and Negative Syndrome Scale (PANSS) [48] score to measure general psychiatric symptoms related to schizophrenia.
Statistical analysis
The demographic and baseline clinical characteristics were compared between patients and healthy participants. For continuous variables, an independent t-test was applied for variables with equal variances whereas WelchŌĆÖs t-test was applied for variables with unequal variances. For categorical variables, the chi-squared test was applied.
The number of abnormal ROIs (Z-score>+1.96 or <-1.96, separately) was compared between patients and healthy participants by an independent t-test or WelchŌĆÖs t-test. This was performed repeatedly for each diffusion measure. Furthermore, for specific diffusion measures that showed significantly different mean abnormal ROI number between the patient group and healthy participants, the associations between the number of abnormal ROIs and the measures of clinical symptoms and neurocognitive function were estimated by SpearmanŌĆÖs rho analysis in the patient group. To correct multiple testing problems, the False Discovery Rate (FDR) method was applied. In addition, for those diffusion measures, the total frequency of each ROI counted as abnormal among the patient group was estimated and visualized to figure out whether there were major ROIs contributing to the pathophysiology of schizophrenia.
All statistical analyses were performed using SPSS Version 21.0 (IBM Corp., Armonk, NY, USA). p-values <0.05 were considered statistically significant.
RESULTS
Demographics and clinical characteristics
The mean age of the patients was 39.12 years (SD=13.01), whereas the mean age of healthy participants was 37.63 years (SD=11.91). However, the difference was not significant [t (126)=0.675, p=0.501]. The male-to-female ratio was not significantly different between the patient group and healthy participants, Žć2 (1, n=128)=0.023, p=0.880. The mean duration of illness in the patient group was 18.00 years (SD=13.20). For clinical symptoms, the mean PANSS positive symptom score was 15.65 (SD=5.34) and the mean PANSS negative symptom score was 14.93 (SD=5.56).
Meanwhile, patients showed significantly lower neurocognitive function on all neurocognitive tests except the FAS test. The mean IQ measured by WASI was 96.74 (SD=17.88) in the patient group and 111.82 (SD=12.08) in healthy participants [t (94.426)=-5.446, p<0.001]. The Symbol Search test t-score was 7.23 (SD=2.86) in patients and 10.55 (SD=2.75) in healthy participants [t (126)=-6.670, p<0.001]. The verbal fluency measured by the FAS test was also impaired in the patient group (M=38.60, SD=8.84) in comparison with the healthy participants (M=51.24, SD=8.78). However, the difference did not reach statistical significance [t (126)=-1.876, p=0.063).
In the Mazes Test from NAB, patients achieved a lower mean t-score of 44.52 (SD=10.79) in comparison with 54.32 (SD=8.36) in healthy participants [t (97.650)=-5.505, p<0.001]. Moreover, the patient group showed a lower mean t-score of 34.95 (SD=14.37) in CPT-IP in comparison with 50.24 (SD=9.85) in healthy participants [t (94.855)=-6.736, p<0.001]. The patients also achieved a lower MSCEIT t-score (M=41.42, SD=12.57) in comparison with healthy participants (M=52.30, SD=9.95), [t (126)=-5.466, p<0.001]. Table 1 shows the demographic and clinical characteristics in detail.
Number of abnormal regions of interest
After counting the number of abnormal ROIs for each subject, we compared the abnormal ROI numbers between the patient group and healthy participants. The number of ROIs with Z-score>+1.96, and <-1.96 were compared separately, and the comparison was repeated with each diffusion measure.
The number of ROIs with increased RD was 11.16 (SD= 13.65) in the patient group and 5.44 (SD=8.97) in healthy participants [t (126)=2.848, p=0.005]. The number of ROIs with increased TR in the patient group was 10.26 (SD=11.87) and 5.49 (SD=8.35) in healthy participants [t (126)=2.664, p=0.009]. Both p-values were unadjusted, but still survived the FDR threshold.
Meanwhile, the number of ROIs with increased AD was 8.35 (SD=9.29) in the patient group and 5.38 (SD=7.31) in healthy participants. The number of ROIs with decreased FA was 5.98 (SD=8.57) in the patient group and 3.25 (SD=7.36) in the healthy participants. Both results showed expected trends, but the differences did not reach statistical significance [AD: t (104.788)=1.974, p=0.051; FA: t (110.834)=1.906, p=0.059]. No other statistically significant difference was observed. All comparisons are shown in Figure 1.
Clinical correlation
For clinical symptoms, there was no statistically significant correlation between PANSS positive symptom scores and the number of ROIs with increased RD or TR [RD: r (57)=0.068, p=0.617; TR: r (57)=-0.021, p=0.875]. PANSS negative symptom scores also did not show a significant correlation to the number of ROIs with increased RD or TR [RD: r (57)=0.167, p=0.215; TR: r (57)=0.093, p=0.490]. For general intelligence, the IQ score measured by WASI showed no significant correlation with the number of ROIs with increased RD or TR [RD: r (57)=-0.105, p=0.438; TR: r (57)=-0.152, p=0.260]. However, few significant associations were found between neurocognitive functions and the number of ROIs with increased RD or TR.
In the Symbol Search test, the numbers of ROIs with increased RD and TR were inversely correlated with t-scores [RD: r (57)=-0.320, p=0.015; TR: r (57)=-0.321, p=0.015]. For verbal fluency, the FAS test t-scores were also inversely associated with the numbers of ROIs with increased RD and TR. However, only the number of ROIs with increased TR reached statistical significance [RD: r (57)=-0.255, p=0.056; TR: r (57)=-0.321, p=0.015]. All p-values were unadjusted, and failed to survive the FDR threshold. For the Mazes Test, CPT-IP, and the MSCEIT, there was no significant correlation between t-scores and the number of abnormal ROIs with increased RD or TR. Detailed correlations are shown in Table 2.
Frequency of each ROI
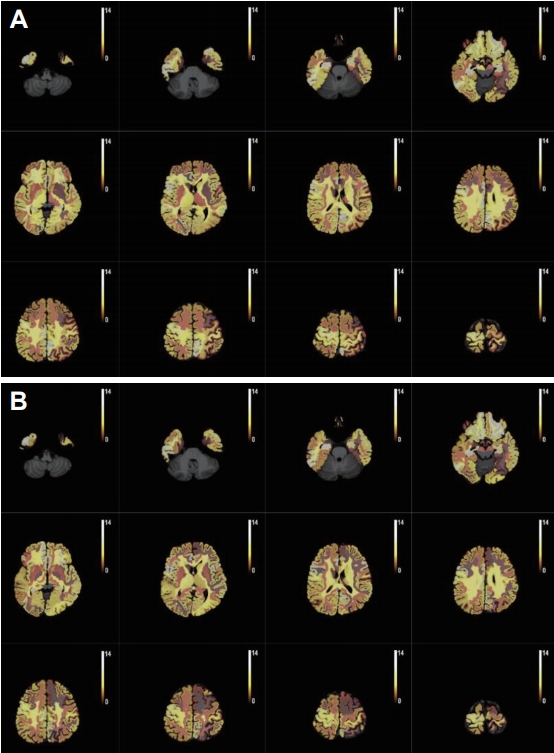
In addition, the total frequency of each ROI counted as having increased RD and TR among the whole patient group was estimated. Almost all ROIs, except 2 for increased RD and except 6 for increased TR, were counted more than at least one time as ŌĆ£abnormalŌĆØ among the patient group. The mean counts were 3.95 (SD=2.49) for increased RD and 3.63 (SD=2.63) for increased TR. Furthermore, we tried to figure out whether there were major ROIs contributing to the pathophysiology of schizophrenia. However, there was no significant pattern of abnormal count for each ROI. Figure 2 shows the frequency by gradient colors.
DISCUSSION
In this study, we investigated 161 ROIs, including both white and grey matter, in the brain of each study participant and counted the number of abnormal ROIs with structural alterations represented by altered diffusivities. Then, we tried to compare the counted numbers between patients with schizophrenia and healthy participants. To our knowledge, this approach has not been tried previously. We believe that this could be an innovative method to evaluate the additive burden of neuronal microstructural alterations throughout the brain of patients with schizophrenia.
Comparison of the numbers of abnormal ROIs with Z-score>+1.96 or Z-score<-1.96 with each diffusion measure (FA, AD, RD, and TR) revealed that the numbers of ROIs with increased (Z-score>+1.96) RD and increased TR were significantly larger in the patient group than in the healthy participants. Since increased RD and TR indicate naturally unfavorable movement of water molecules due to the destruction of cellular microstructures such as myelin sheath [49,50] and decreased membrane density due to alterations of cellularity caused by edema or necrosis [51], respectively, it was anticipated that patients with schizophrenia possess larger numbers of abnormal ROIs with increased RD and TR as shown in our study.
Meanwhile, the numbers of ROIs with decreased FA and increased AD were also larger in patients with schizophrenia. Since FA represents well-established connectivity between neurons [52] and increased AD indicates disintegration of axons due to axonal damage by inflammation [53], the brain with schizophrenia was expected to show decreased FA and increased AD. However, we only found trends without statistical significance, contrary to the findings obtained with RD and TR. This might be due to the physiological sensitivity of RD and TR in this study since we investigated both white and grey matter of the brain.
Since only the numbers of ROIs with increased RD and TR seemed to be significantly larger in the patient group in comparison with healthy participants, the associations between these two numbers and measures of clinical symptoms and neurocognitive function were estimated by SpearmanŌĆÖs rho analysis in the patient group. However, the number of abnormal ROIs by any diffusion measure showed no significant correlation to symptom severities measured by PANSS scores. This result was not consistent with current literature, which reported correlations between symptom severity and increased RD [54] or TR [55] in patients with schizophrenia. However, considering the hypothesis that the number of abnormal ROIs represents comprehensive brain structural abnormality, this number might not be directly related to psychiatric symptoms, which are generally determined by few specific anatomical regions. For instance, one of the most common psychiatric symptoms, auditory hallucination, was previously known to be related to few specific ROIs [56].
In terms of neurocognitive function, few significant associations with the numbers of abnormal ROIs were still found. The numbers of ROIs with increased RD and TR were inversely associated with the t-scores in the Symbol Search test, and the number of ROIs with increased TR was also inversely associated with the FAS test t-score. This result was in accordance with previous studies showing that patients with schizophrenia generally have impaired processing speed [57]. Furthermore, verbal fluency measured by the FAS test deteriorated as the number of ROIs with increased TR became larger. Schizophrenia patients are known to show impaired verbal fluency due to the fronto-striatal dysfunction [58]. In fact, numerous studies [18,23,59,60] have already reported the correlation between altered diffusivity and cognitive dysfunction.
However, there was no significant correlation between the numbers of abnormal ROIs with increased RD or TR and t-scores in the Mazes Test, the CPT-IP, and the MSCEIT, although patients with schizophrenia have been known to show impaired visuospatial function [61], impaired attention [62], and social cognition [63]. This finding could be attributed to the generally small number of abnormal ROIs achieved with each diffusion measure. Since we arbitrarily set the cutoff Z-score from the p-value of 0.05 (95%) without a physiological or statistical standard, the number of abnormal ROIs might be too small. Considering the different physiological characteristics in each anatomical region, the cutoff for each ROI should have been different. Further research considering the physiological characteristics of each anatomical region is recommended.
In addition, by estimating the total frequency of each ROI counted as having increased RD and TR among the whole patient group, we found that there was no significant pattern of abnormal count for each ROI. In other words, it was suggested that not only few major ROIs, but a number of different ROIs contributed to the pathophysiology of schizophrenia. This also suggested that schizophrenia is attributable to the additive burden of structural alterations within multiple brain regions. In fact, previous studies also reported widespread white matter pathology in schizophrenia [9,64]. However, in this study, we additionally used more diffusion measures other than FA and found that this widespread pathology might also involve both white and even grey matter.
Notably, the study had some limitations. First, the group differences in diffusion measures might be attributable to head motion, not physiological differences [65]. However, we did adjust the head motion by affine transformation to minimize the artifacts. In addition, previous studies had no consensus on whether schizophrenia patients show increased head motion due to the psychiatric symptoms [66-68]. Second, although we investigated diffusivities of both white and grey matter to comprehensively understand the abnormalities of the brain with schizophrenia, the physiological difference between white and grey matter should be taken into account. Thus, as mentioned before, we used additional diffusion measures other than FA which are less affected by lower anisotropy of grey matter comparing to white matter. In fact, RD and TR were revealed as significant in this study. Third, we did not include antipsychotic medication for analyses due to the limited data. Since it has been suggested that antipsychotic medications can alter diffusion measures [21,69], further research with medication data is strongly recommended. Moreover, the duration of illness was also excluded in analyses. Since a number of studies have reported gradual deterioration of the brain with schizophrenia [70,71], further investigation with information regarding the illness duration is also suggested.
Despite these limitations, we found a few remarkable differences in the number of abnormal ROIs between patients with schizophrenia and healthy participants. Although there have been numerous studies on the alterations in diffusion measures in the brain with schizophrenia [72] since the introduction of DTI in schizophrenia research [14], most of them focused only on white matter of the brain and often single anatomical ROI. Previous studies usually compared the mean value of diffusion measures between patients and healthy participants. Although these studies reported a few noticeable findings, there was no consensus regarding the pathognomonic anatomical region related to schizophrenia. Thus, we hypothesized that instead of a single anatomical region, multiple regions concurrently cause schizophrenia. In other words, a number of small physiological alterations in each brain region may concurrently result in disease development, similar to the polygenic model. By counting and comparing the number of abnormal ROIs by each diffusion measure, we could determine the additive burden of altered diffusivity in the brain.
In conclusion, we identified not only a significant increase in number of abnormal ROIs in patients with schizophrenia, but also the fact that these abnormal ROIs were widespread over the whole brain, including both white and grey matter. Furthermore, there were even clinical correlations with the number of abnormal ROIs. This strongly suggested that schizophrenia is not caused by the pathology of a single brain region, but is instead attributable to the additive burden of structural alterations within multiple brain regions. Furthermore, the findings also suggested that assessments of the additive burden of all regions instead of a single anatomical region could be an innovative approach for DTI studies in schizophrenia. Future research with other neuroimaging data is required for generalizing and verifying the results from this study.