


INTRODUCTION
The number of individuals with dementia is increasing globally, with more than 130 million people expected to live with dementia in 2050 [1]. AlzheimerŌĆÖs disease (AD) is the most prevalent type and cause of dementia [2], with no cure currently available yet. Early detection of AD is crucial because it allows for advanced treatment planning and improves prognosis. However, due to the insidious nature of the disease, more than 60% of people living with dementia in the community go undetected [3]. In order to improve the accuracy and advance the timing of AD diagnosis, the National Institute on Aging-AlzheimerŌĆÖs Association proposed new diagnostic criteria for AD that incorporates neuroimaging biomarkers such as amyloid beta (A╬▓) deposition and neuronal degeneration [4-7]. Assessment of A╬▓ deposition (performed using positron emission tromography [PET]) is an earlier and more specific biomarker of AD than assessments of neurodegeneration (performed using magnetic structural imaging [MRI]). However, PET has practical drawbacks in clinical practice because they involve radiation and are not available in all clinical settings.
Structural brain MRI is more widely available but less expensive and invasive than PET. It can also detect structural changes related to many brain diseases other than AD. Several recent studies [8-13], including our previous work [14], have developed artificial intelligence (AI)-based algorithms for classifying AD using structural brain MRI, with promising results in terms of processing time and classification accuracy. In the case of our previous work, our deep learning-based classification system for AD using structural brain MRI (DLCS) demonstrated excellent accuracy in classifying probable AD patients from cognitively normal controls (area under the curve [AUC]=0.88-0.94). However, previous studies included the following limitations. First, most previous studies [9,10,12-14] are likely to have overestimated performance because the training and validation datasets were constructed by randomly splitting a single population into subsets, leaving its performance in newly seen data unknown. Second, it is unclear as to what proportion of true AD patients and normal controls were used in the previous studies, because most did not confirm the presence or absence of A╬▓ deposition in their AD patients and normal controls, respectively [9-14]. A╬▓ positivity is an important supporting evidence for presence of AD [5]. When considering that about 12% of clinically diagnosed probable AD patients are A╬▓-negative [15] and 10%-40% of cognitively normal controls are A╬▓-positive [16], checking for the presence of A╬▓ is an important control factor in order to exclude any seemingly AD cases of different etiology from the AD group and to exclude preclinical AD cases from the normal control group [14]. Third, many studies [10-14] only included dementia patients in their AD group, which may have exaggerated performance in normal cognition (NC) vs. AD classification tasks. Including AD patients with mild cognitive impairment (MCI) is expected to offer a more comprehensive measure of the modelŌĆÖs performance across the AD continuum.
In this study, we performed a clinical trial with a well-defined case-control population that can address the aforementioned limitations in our previous work. We investigated the performance of the DLCS in discriminating A╬▓-positive patients with MCI or AD dementia (MCI/dementia due to AD) from A╬▓-negative cognitively normal controls, all of whom were from a sample independent of the population used for the development of the DLCS.
METHODS
Study participants
A single-center, case-controlled clinical trial was conducted and registered in the Korean Clinical Trials Registry (KCT0004758, 21/02/2020). Data of subjects over 50 years of age who visited Seoul National University Bundang Hospital (SNUBH) and underwent a T1-weighted MRI scan between January 2010 and September 2019 were retrospectively collected. Our data include brain MRI scans with clinical assessment and 18F-florbetaben PET scans from visitors to dementia clinic at the Department of Neuropsychiatry in SNUBH as well as from participants of the Korean Longitudinal Study on Cognitive Aging and Dementia (KLOSCAD) [17].
A group of patients with AD and a group with NC matched for age and sex were screened and enrolled using the following inclusion criteria. The AD group included patients diagnosed as MCI due to AD or dementia due to AD [5], according to the following criteria: 1) a diagnosis of probable or possible AD according to the National Institute of Neurological and Communicative Disorders and Stroke and the AlzheimerŌĆÖs Disease and Related Disorders Association (NINCDS-ADRDA) criteria, or MCI according to the International Working Group on MCI, and 2) amyloid deposition as determined by a positive 18F-florbetaben PET scan. The NC group included those who 1) had no subjective cognitive complaints, 2) had no objective cognitive decline in the Korean version of the Consortium to Establish a Registry for AD (CERAD-K) neuropsychological assessment battery, 3) were functioning independently in the community, and 4) had no amyloid deposition as determined by a negative 18F-florbetaben PET scan. Subjects who had any of the following conditions were excluded: 1) diagnosis of dementia with a cause other than or in addition to AD, i.e., mixed dementia, 2) brain pathologies on T1-weighted MRI that may cause cognitive deficits, 3) more than 1 year between the date of clinical assessment and date of MRI scan (NC and MCI participants only), and 4) white matter hyperintensities with a FazekaŌĆÖs rating of 3 or higher on fluid-attenuated inversion recovery images.
The data of the participants were retrospectively screened and collected starting from April 27, 2020 to June 5, 2020 (6 weeks). The employment of the DLCS on the data were conducted between June 8, 2020 to June 19, 2020 (2 weeks).
Sample size calculation
We employed both the sensitivity and specificity of DLCS to AD as primary outcome measures. We calculated the sample size needed to evaluate whether DLCS performed better than a reference, based on a one-sided ╬▒ of 2.5% (Z╬▒=1.96), statistical power of 80% (Z1-╬▓=0.842), and the results of a pilot study. The pilot study tested the performance of DLCS using a dataset consisting of 367 AD patients and 316 controls with NC: 130 AD and 130 NC from SNUBH and 237 AD and 186 NC from the AlzheimerŌĆÖs Disease Neuroimaging Initiative database. At a threshold value of 0.38, the DLCS yielded a sensitivity of 82.0% (95% confidence interval [CI], 77.7%-85.8%) and specificity of 83.2% (95% CI, 78.6%-87.2%). To calculate the sample size n, we used the following formula [18]:
where p0 is the assumed sensitivity/specificity under the null hypothesis H0, and p1 is the targeted sensitivity/specificity under alternative hypothesis H1. The p0 and p1 values were defined as the lower and higher bounds of the 95% CI of the sensitivity and specificity from the pilot study (p0=0.777 and p1=0.858 for sensitivity; p0=0.786 and p1=0.872 for specificity). The null hypothesis was that the sensitivity/specificity of the DLCS is less than or equal to the lower boundary of the assumed sensitivity/specificity. The alternative hypothesis was that it is higher. Based on this, the necessary number of subjects with the disease was 188, and the number of subjects without the disease was 162. Therefore, the final estimated sample size was 350 subjects, consisting of 188 patients with AD and 162 normal controls that were matched for age (<5 years apart) and sex to the AD group.
Image acquisition
We acquired three-dimensional (3D) T1-weighted MR images in Digital Imaging and Communications in Medicine format using Philips Achieva and Ingenia scanners (Philips Medical Systems, Eindhoven, The Netherlands). The parameters were as follows: voxel dimensions=1.0├Ś0.5├Ś0.5 mm3, slice thickness=1.0 mm, echo time=8.15 or 8.20 ms (for Achieva and Ingenia, respectively), repetition time=4.61 ms, flip angle=8┬░, and field of view=240├Ś240 mm.
We acquired 18F-florbetaben PET scans in 3D using a Discovery VCT scanner (General Electric Medical Systems, Milwaukee, WI, USA). The subjects were injected with 8.1 mCi (300 MBq) 18F-florbetaben (Neuraceq; Life Molecular Imaging Ltd., Berlin, Germany) through a slow single intravenous bolus (6 MBq) in a total volume of 10 mL. After a 90-min uptake period, 20-min PET images comprising four 5-min dynamic frames were obtained. Images of each time frame were reframed into one summed frame. Board-certified nuclear medicine physicians then determined A╬▓-positivity based on visual interpretation of tracer uptake in the gray matter compared to neighboring subcortical white matter in the following four brain regions: the temporal lobes, frontal lobes, posterior cingulate cortex/precuneus, and parietal lobes.
DLCS
We used VUNO Med-DeepBrain AD (version 1.0.0; VUNO Inc., Seoul, South Korea), which is the DLCS for AD. The convolutional neural network model used in VUNO MedDeepBrain AD has been previously described [14]. Briefly, the DLCS uses as its backbone the Inception-V4 architecture, which is a 2D image classification convolutional neural network that achieved very good performance with low computational cost [19]. The network uses pretrained weights (https://github.com/Cadene/pretrained-models.pytorch#inception) obtained from a subset of ImageNet [20], which is a training dataset of 1.28 million nautral images. The DLCS receives a subjectŌĆÖs T1-weighted image, extracts 30 coronal slices from areas that span the medial temporal lobe, and feeds each coronal slice as a separate input into the pretrained Inception-V4 architecture. From this, the network extracts various features that include structural and textural information of the brain from the coronal slice. The feature vector is then concatenated with the subjectŌĆÖs age and sex information (which is input to the system at the beginning with the MRI scan) and the location information (slice number) of the coronal slice. The concatenated feature vector is entered into a fully connected network that calculates the probability of the slice belonging to that of a patient with AD. The probabilities of each slice are averaged to calculate a final score that represents the subjectŌĆÖs probability of having AD (score ranges from 0 to 1).
In this clinical trial, we processed the MRI data of subjects anonymously, omitting information that could identify the individual (name, sex, birth date, and hospital number). A researcher (K.J.S.), who was blinded to the subjectsŌĆÖ clinical diagnoses and did not participate in the construction of the study dataset, performed the processing of the subjectsŌĆÖ data with DLCS. The DLCS was installed on a desktop PC with the following specifications: Intel hexa-core 2.90 GHz CPU with 16 GB RAM running on Ubuntu 18.04.4 LTS.
Statistical analysis
We evaluated the accuracy of the DLCS in the diagnosis of AD by comparing its output (a continuous probability ranging from 0 to 1) with the subjectŌĆÖs clinical diagnosis. We defined sensitivity and specificity as the primary outcomes, and the area under the receiver operating characteristic curve (AUC) as the secondary outcome. We calculated the outcomes on the whole dataset, as well as in sex, age, and Mini-Mental State Examination (MMSE) subgroups. The age groups were divided into Ōēź75 years and <75 years of age, based on the median age of 75 years. The MMSE subgroups were divided into Ōēź26 and <26 scores. In addition, in a subgroup of subjects with MMSE scores, we compared the performance of DLCS with that of MMSE score for the diagnosis of all AD (MCI and dementia due to AD as well as of just MCI due to AD), on the basis of the following evaluation metrics: AUC, accuracy, sensitivity, specificity, positive predictive value (PPV), and negative predictive value (NPV).
For demographics, continuous variables were compared using independent samples t-test, and categorical variables were compared using the chi-square test between groups. We estimated the 95% CI of sensitivity and specificity using the Clopper-Pearson method [21] and the AUC using the DeLong test [18]. For comparison of evaluation metrics between sex-, age-, and MMSE-subgroups, we used chi-square test. In the comparison of evaluation metrics between the DLCS and MMSE, we used McNemar test [22] for comparing accuracy, sensitivity, and specificity, and two-sample z-test for comparing PPV and NPV. All statistical analyses were performed using IBM SPSS, version 20 (IBM Corp., Armonk, NY, USA) and MedCalc (version 16.4.3; MedCalc Software, Mariakerke, Belgium).
Standard protocol approvals, registrations, and patient consents
This clinical trial (Korean Clinical Trials Registry identifier: KCT0004758) was approved by the Ministry of Food and Drug Safety in South Korea and the Institutional Review Board of SNUBH (E-2001/588-001). The design and conduct of this study were in accordance with the principles outlined in the Declaration of Helsinki [23]. Because this clinical trial was conducted retrospectively, participation consent forms from subjects or legal guardians of the subjects were waived. All methods were carried out in accordance with relevant guidelines and regulations.
RESULTS
We enrolled a total of 350 subjects who met the eligibility criteria, with 162 (46.3%) in the NC group and 188 (53.7%) in the AD group. The demographic and clinical characteristics of the participants are summarized in Table 1. The mean age of the whole dataset was 73.3┬▒7.23 (range, 55 to 92) years. Age and sex were comparable between the NC and AD groups, while years of education were higher in the NC group. In the patient group, 76 (40.4%) had MCI due to AD, the rest had dementia due to AD (12 [6.4%] possible AD and 99 [52.7%] probable AD). All participants with MCI due to AD had a clinical dementia rating (CDR) score of 0.5. Among the 112 participants with AD dementia, 68 (60.7%) had a CDR score of 0.5, 35 (31.3%) had a CDR score of 1, and the rest (8.0%) had a CDR score of 2 or 3. The models of MR scanners were comparable, while the type of head coil was different between the two groups. The volume of white matter hyperintensity was comparable between the NC and AD groups.
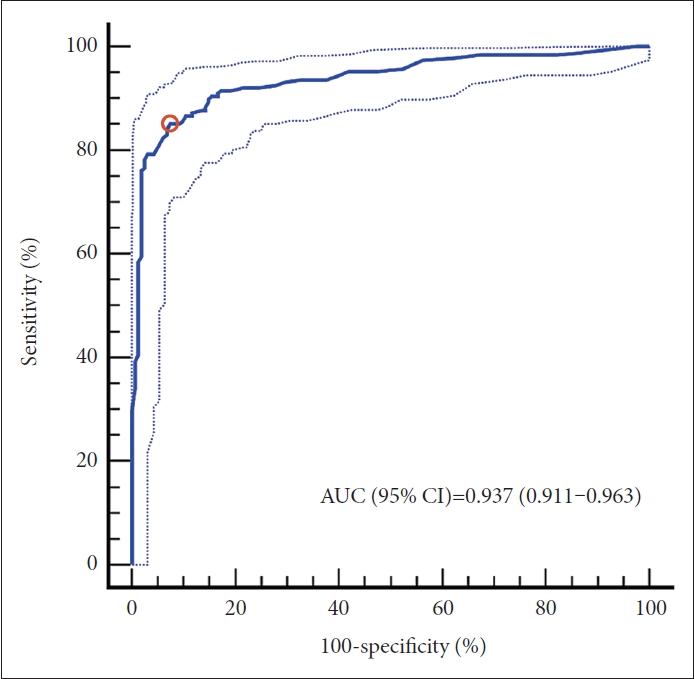
As summarized in Figure 1, the DLCS demonstrated a good diagnostic performance in the classification of AD. The DLCS had a sensitivity for AD of 85.6% (95% CI, 79.8%-90.3%), and the lower bound of 95% CIs for its sensitivity was higher than the assumed value of 77.7%. Its specificity for AD was 90.1% (95% CI, 84.5%-94.2%), and the lower bound of 95% CIs for its specificity was higher than the assumed value of 78.6%. Its accuracy, PPV, and NPV for AD were 87.7%, 91.0%, and 84.4%, respectively. The AUC of DLCS for AD classification was 0.937 (95% CI, 0.911-0.963).
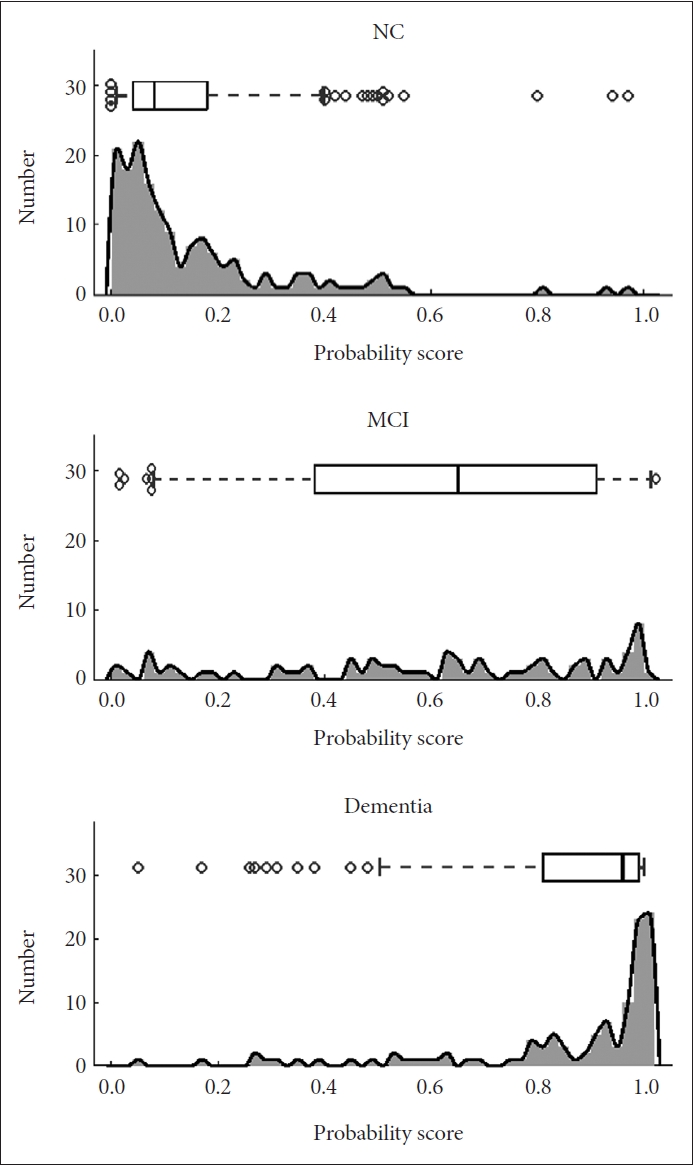
The distribution of the DLCS probability scores for each cognitive group, NC, MCI, and dementia, are shown as histograms and boxplots in Figure 2.
Further analyses were conducted in various subgroups, summarized in Table 2. When analyzed separately in the male and female subgroup (n=117 and 233, respectively), there were no significant differences in sensitivity, specificity, and AUC. When analyzed separately in each age group, sensitivity was higher in the Ōēź75 years group (n=186), while specificity was higher in the <75 years group (n=164). There were no significant age-wise differences in AUC. In the comparison between participants stratified by MMSE score (Ōēź26 vs. <26), the AUC was comparable between the two MMSE subgroups. However, specificity was higher in the subgroup with MMSE of Ōēź26 (n=166), whereas sensitivity was higher in the subgroup with MMSE of <26 (n=179).
Table 3 summarizes results of the comparative analysis between DLCS and MMSE in a subgroup who have MMSE scores. In the diagnosis of AD (n=345), the AUC of DLCS (AUC, 0.936; 95% CI, 0.905-0.960) was larger than the AUC of MMSE score (AUC, 0.907; 95% CI, 0.871-0.935) by a marginally larger value (p=0.0718). The sensitivity and specificity of DLCS were 85.8% (95% CI, 79.9%-90.5%) and 90.1% (95% CI, 84.5%-94.2%). At a cutoff value of 25 indicated by the YoudenŌĆÖs index, the MMSE had a sensitivity of 78.1% (95% CI, 71.4%-83.9%) and specificity of 91.4% (95% CI, 85.9%-95.2%). The sensitivity of DLCS was stastistically significantly higher than that of MMSE (p=0.034). In the diagnosis of patients with MCI due to AD (n=238), the AUC of DLCS (AUC, 0.877; 95% CI, 0.829-0.916) was marginally higher than that of MMSE (AUC, 0.823; 95% CI, 0.768-0.869). The sensitivity and specificity of DLCS were 73.7% (95% CI, 62.3%-83.1%) and 90.1% (95% CI, 84.5%-94.2%), and that of MMSE were 59.2% (95% CI, 47.3%-70.4%) and 91.4 (95% CI, 85.9%-95.2%), respectively.
DISCUSSION
In this clinical trial, we evaluated the use and performance of a DLCS in the identification of an individualŌĆÖs risk of AD. To the best of our knowledge, this is the first clinical trial in the field of AI-based AD diagnosis to obtain regulatory approval as a class III medical device from the Ministry of Food and Drug Safety.
The results of this clinical trial demonstrate that the DLCS has excellent diagnostic performance for AD, according to the criteria of excellent biomarkers proposed by the Ronald and Nancy Reagan Research Institute of the AlzheimerŌĆÖs Association and the National Institute on Aging Working Group on ŌĆ£Molecular and Biochemical Markers of AlzheimerŌĆÖs Disease.ŌĆØ [24] The working group suggested that an excellent evaluating biomarker should have a sensitivity approaching or exceeding 85%, a specificity of approximately 75%-85% or greater, and a PPV of approximately 80% or more. The sensitivity, specificity, and PPV of the DLCS were 85.8%, 90.1%, and 90.8%, respectively, which met the requirements proposed by the working group. This is also comparable to or better than that of existing methods. The clinical diagnosis of probable AD according to the NINCDS-ADRDA criteria has shown a sensitivity of 70.9%-75.3% and a PPV of 59.5%-70.8% for autopsy-proven AD [25]. Fluorodeoxyglucose PET has sensitivities of 84% and 75.8% and specificites of 74% and 74.3% for autopsy-proven AD [26] and amyloid PET-proven AD [27], respectively. Cerebral blood flow single-photon emission computed tomography (SPECT) showed sensitivies of 63% and 42.9% and specificities of 82% and 82.9% for autopsy-proven AD [28] and amyloid PET-proven AD [27], respectively.
The DLCS was evaluated in relation to convetional measures such as MMSE score. As seen in Table 2, the notable specificity of the DLCS for AD in a population with high MMSE score is pivotal because it offers the potential to be used in conjunction with highly sensitive quick cognitive tests in AD diagnosis. Also as seen in Table 3, the DLCS exhibited a slightly higher AUC and significantly higher sensitivity in detecting dementia or MCI due to AD compared to MMSE. This has clinical implications, given that the preclinical and prodromal phases of AD last for more than a decade. The DLCS shows potential to be used as a means to increase the sensitivity of the diagnosis of AD, especially when combined with cognitive tests such as the MMSE.
The rate of undetected dementia in community-dwelling elderly is pooled to be 61.7% (95% CI=55.0%-68.0%), according to a meta-analysis [3]. The rate of undetected cases of dementia due to AD, which is the largest cause of dementia, is even higher because of its slow progressive onset [29]. This warrants a method that can effectively and accurately diagnose AD in its early stages. While amyloid PET [30] has the potential to detect AD in its preclinical stages, their use in clinical settings is restricted to cases of diagnostic uncertainty in patients with cognitive impairment [31]. In contrast, structural brain MRI is also capable of detecting early changes [32-35] and have the additional benefit of being widely administered for a variety of purposes such as diagnosing various types of dementia and neurologic disorders and even for health checkups. Thus, utilizing structural MRI allows for an opportunity to screen a broader range of individuals for possible dementia.
The DLCS offers a structural brain MRI-based diagnosis of AD, with strengths that allow ease of use in clinical practice. The DLCS takes 3 simple inputs-patient age, patient gender, and a T1-weighted MRI scan of the patient. Once uploaded, it outputs the result (probability of the subject having AD), within 23 seconds. The DLCS uses a pre-learned neural network, which eliminates the need for other preprocessing steps [14], and extracts information that is expected to comprehensively reflect volumetric, shape, and textural information. The short processing time and simplicity of use make it feasible to use in clinical settings, in contrast to other previously developed structural MRI-based diagnostic markers [32-35] that have good diagnostic performance but require heavy data processing and longer processing time. Furthermore, the DLCS can be embedded to clinical routine workflow such that MRI scans taken for whichever purpose can be quickly and efficiently screened for possible AD. This can extend AD screening to patients who had visited the hospital for reasons other than cognitive complaints, and may help clinicians to catch potential AD cases that may otherwise go unnoticed and direct them for a fuller battery of tests that can lead to a timely diagnosis of AD.
To accurately assess the performance of DLCS for AD, our study population consisted of amyloid PET-confirmed cases of AD and non-AD. This contrasts with most previous studies which used clinical diagnosis as the criteria for defining the AD group and control group [9-13]. Clinically determined AD dementia patients may have AD-like symptoms but not actually have AD pathology, and cognitively normal-seeming individuals may have underlying amyloid pathology in which case they would be recognized as preclinical AD [16]. Thus we used amyloid PET results to prevent enrollment of non-AD dementia cases to the AD patient group and preclinical AD cases to the normal control group, thereby minimizing misclassification bias.
Second, we included patients with MCI due to AD in the patient group so that we can see the performance of DLCS in detecting AD from varying degrees of cognitive deficits along the AD continuum [5]. This allows for a more accurate assessment of the softwareŌĆÖs ability to discriminate AD across the cognitive severity spectrum.
Identifying AD in MCI patients due to AD proved to be a challenge, as shown in the wide distribution of probability scores for MCI patients in Figure 2. This may be attributed to MCI being a heterogenous group with structural brain changes that are not as different from that of NC. It was also observed in the age and sex subgroup analysis that the proportion of MCI patients in the AD group may affect the DLCS performance. The relatively lower sensitivity values in the male and younger groups may be associated with the higher proportion of MCI patients in the AD group in the male subgroup (47.6%) compared to the female subgroup (37.6%), and in the younger group (48.3%) compared to the older group (34.7%). However, it is noteworthy that our proposed method was trained only on NC and possible/probable AD patients, and that the MCI patients are completely newly seen data to the DLCS. This supports the potential of MRI-based deep learning methods for AD classification, and further studies involving training with MCI patients included should lead to more promising results in the future.
It should be noted that composition of AD patients can be different across studies, depending on their definition of the AD group. In general, AD diagnosis is used to refer to detection of AD patients as defined by clinical diagnostic criteria. In this paper, because our interest was in detecting patients with amyloid PET-proven AD, AD diagnosis refers to detection of MCI due to AD and dementia due to AD [5], which requires amyloid positivity in addition to clinically diagnosed MCI and clinically diagnosed AD. This diagnostic criteria of AD 5 was proposed for research purposes but it is also widely used in clinical practice [36], which supports our use of it for this clinical study. It should also be noted that there are also cases in clinical settings where the clinical trajectory seems like that of AD but are amyloid-negative (suspected non-AlzheimerŌĆÖs pathophysiology, SNAP). Future studies focusing on discriminating between SNAP and AD will be necessary to ensure accurate detection of AD.
There are several technical considerations to be addressed. First, all MRI scans used in this study were acquired from a single scanner (Philips) using the same protocol. Therefore, the performance of the DLCS on scans from other vendors or protocols remains to be determined. Second, the DLCS currently only takes 3D T1-weighted images as input data because 3D scans contain higher anatomical detail and resolution than conventional 2D scans. However, 3D scans are not available in all clinical settings, which may restrict the use of DLCS to fewer settings. Third, it is not clear which features contribute to the predictions made by the DLCS, which can undermine the explainability of the results. Increasing the explainability and interpretability of deep learning algorithms will be crucial in increasing the trustworthiness of the technology for use in the medical domain. This is an unresolved issue that is currently the topic of many recent research [37].
In conclusion, DLCS, a software as a medical device using structural brain MRI, demonstrated excellent diagnostic performance for MCI or dementia due to AD. When used together during screening of MRI, taken for whichever purpose, DLCS may help improve the early detection of AD.