Machine Learning on Early Diagnosis of Depression
Article information

Abstract
To review the recent progress of machine learning for the early diagnosis of depression (major depressive disorder). The source of data was 32 original studies in the Web of Science. The search terms were “depression” (title) and “random forest” (abstract). The eligibility criteria were the dependent variable of depression, the interventions of machine learning (the decision tree, the naïve Bayesian, the random forest, the support vector machine and/or the artificial neural network), the outcomes of accuracy and/or the area under the receiver operating characteristic curve (AUC) for the early diagnosis of depression, the publication year of 2000 or later, the publication language of English and the publication journal of SCIE/SSCI. Different machine learning methods would be appropriate for different types of data for the early diagnosis of depression, e.g., logistic regression, the random forest, the support vector machine and/or the artificial neural network in the case of numeric data, the random forest in the case of genomic data. Their performance measures reported varied within 60.1–100.0 for accuracy and 64.0–96.0 for the AUC. Machine learning provides an effective, non-invasive decision support system for early diagnosis of depression.
INTRODUCTION
Major depressive disorder (depression hereafter) is a leading cause of disease burden in the world, affecting 300 million people on the globe [1-6]. Depression, defined as “a mood disorder that causes a persistent feeling of sadness and loss of interest,” [1] is a diagnostic category of mental disorder together with anxiety disorder [2]. Its global incidence registered a rapid growth of 47.86% from 172 million to 258 million during 1990 to 2017 [3]. It ranked third in the world for 2017 and second in Korea for 2010 in terms of years lost to disability and disability-adjusted life years, respectively [4,5]. It is considered to have a wide range of determinants including demographic factors (age, sex), socioeconomic status (education, employment, income), neighborhood conditions (crowding, housing, pollution, violence) and health-related factors (drinking, exercise, smoking, diseases, genetics) [6,7]. Recently, on the other hand, the terms “deep learning,” “machine learning” and “artificial intelligence” have attracted great attention all over the globe. For instance, their Google trends recorded ten-fold expansions from 10 to 100 during 2013–2018. Artificial intelligence can be defined as “the capability of a machine to imitate intelligent human behavior” (the Merriam-Webster dictionary). The definition of machine learning can be a division of artificial intelligence to “extract knowledge from large amounts of data.” [8]
Six common machine learning algorithms are the decision tree, the naïve Bayesian predictor, the random forest, the support vector machine, the artificial neural network, and the deep neural network (deep learning). A decision tree has three components: an intermediate node (a test on an independent variable), a branch (an outcome of the test) and a terminal node (a value of the dependent variable). A naïve Bayesian predictor makes an early diagnosis based on Bayes’ theorem, which states that the probability of the dependent variable given certain values of independent variables comes from the probabilities of the independent variables given a certain value of the dependent variable. A random forest is a collection of many decision trees, which make majority votes on the dependent variable (“bootstrap aggregation”). Let us take a random forest with 1,000 decision trees as an example. Let us assume that original data includes 10,000 participants. Then, the training and test of this random forest takes two steps. Firstly, new data with 10,000 participants is created based on random sampling with replacement, and a decision tree is created based on this new data. Here, some participants in the original data would be excluded from the new data and these leftovers are called out-of-bag data. This process is repeated 1,000 times, i.e., 1,000 new data are created, 1,000 decision trees are created and 1,000 out-of-bag data are created. Secondly, the 1,000 decision trees make predictions on the dependent variable of every participant in the out-of-bag data, their majority vote is taken as their final prediction on this participant, and the out-of-bag error is calculated as the proportion of wrong votes on all participants in the out-of-bag data.
A support vector machine originates a line or space called a “hyperplane” (a collection of “support vectors”). The hyperplane divides data with the greatest distance between different sub-groups [8]. An artificial neural network is a network of “neurons”, i.e., information units combined through weights. Usually, the artificial neural network has one input layer, one, two or three intermediate layers and one output layer. Neurons in a previous layer connect with “weights” in the next layer and these weights represent the strengths of connections between neurons in a previous layer and their next-layer counterparts. This process starts from the input layer, continues through intermediate layers and ends in the output layer (feedforward operation). Then, learning happens: these weights are accommodated based on how much they contributed to the loss, a difference between the actual and predicted final outputs. This process starts from the output layer, continues through intermediate layers and ends in the input layer (backpropagation operation). The two operations are replicated until a certain expectation is met regarding the accurate diagnosis of the dependent variable. Finally, a deep neural network is an artificial neural network with a large number of intermediate layers, e.g., 5, 10 or even 1,000. The deep neural network is called “deep learning” given that learning “deepens” through numerous intermediate layers [9].
Traditional research considers a limited scope of predictors for the early diagnosis of disease, whereas adopting logistic regression with an unrealistic assumption of ceteris paribus, i.e., “all the other variables staying constant.” In this context, emerging literature uses artificial intelligence for the early diagnosis of disease, e.g., arrhythmia [9], birth outcome [10-15], cancer [16-19], comorbidity [20-22], menopause [23] and temporomandibular disease [24,25]. It does not require unrealistic assumptions of “all the other variables staying constant” while managing to analyze which predictors are more important for the early diagnosis of the dependent variable. The purpose of this study is to review the recent progress of machine learning for the early diagnosis of depression.
METHODS
Figure 1 shows the flow diagram of this study. Thirty two original studies were selected for review out of 120 original studies in the Web of Science with the search terms “depression” (title) and “random forest” (abstract). The eligibility criteria of this review were: 1) the intervention(s) of the decision tree, the naïve Bayesian predictor, the random forest, the support vector machine and/or the artificial neural network; 2) the outcome(s) of accuracy and/or the area under the receiver operating characteristic curve (AUC) for the early diagnosis of depression; 3) the publication year of 2000 or later; 4) the publication language of English; 5) the publication journal of Science Citation Index Expanded and/or Social Science Citation Index; and 6) depression being the dependent variable. The following summary measures were adopted: machine learning methods, sample size, data type, performance measures, and important predictors. Here, accuracy can be defined as the proportion of correct predictions over all observations, while the AUC can be defined as the area under the plot of the true positive rate (sensitivity) against the false positive rate (1- specificity) at various threshold settings.
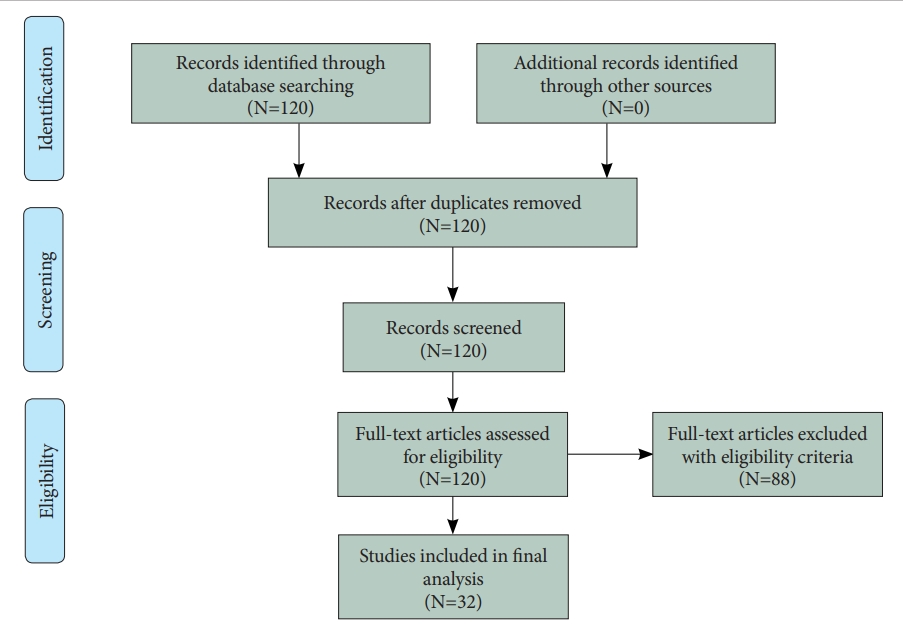
Flow diagram.
RESULTS
Review summary
The summary of review is shown in Tables 1 and 2 [26-57]. The tables have five summary measures, i.e., machine learning methods, sample size, data type, performance measures, important predictors, and whether the variable importance of the random forest is reported (VI-Yes 1). Based on the results of this review, different machine learning methods would be appropriate (i.e., would show the best performance measures) for different types of data for the early diagnosis of depression: 1) logistic regression, the random forest, the support vector machine and/or the artificial neural network in the case of numeric data; 2) the random forest in the case of genomic data; 3) the random forest and/or the support vector machine in the case of radiomic data; and 4) the random forest in the case of social-network-service data. Their performance measures reported varied within 60.1–100.0 for accuracy, 68.8–95.0 for sensitivity, 76.0–94.0 for specificity, and 64.0–96.0 for the AUC (Table 1). According to the findings of this review, indeed, the following predictors would be important variables for the early diagnosis of depression: comorbid psychopathology, symptom-related disability, treatment credibility, access to therapists, time spent using certain internet-intervention modules; pain-fatigue (symptom intensity scale), comorbidity; 30 microbial markers (gut microbiota); psychological elasticity, income level; upper body movements-postures; brain connectivity within posterior cingulate cortex, within insula, between posterior cingulate cortex and insula/hippocampus-amygdala, between insula and precuneus, between superior parietal lobule and medial prefrontal cortex; single-nucleotide polymorphisms (rs12248560, rs878567, rs17710780); cingulate isthmus asymmetry, pallidal asymmetry, ratio of the paracentral to precentral cortical thickness, ratio of lateral occipital to pericalcarine cortical thickness; self-assessed cardiac-related fear, sex, number of words to answer the first homework assignment for internet-delivered psychotherapy (Table 2). However, machine learning is a datadriven method and more study is to be done with more external data for greater external validity.
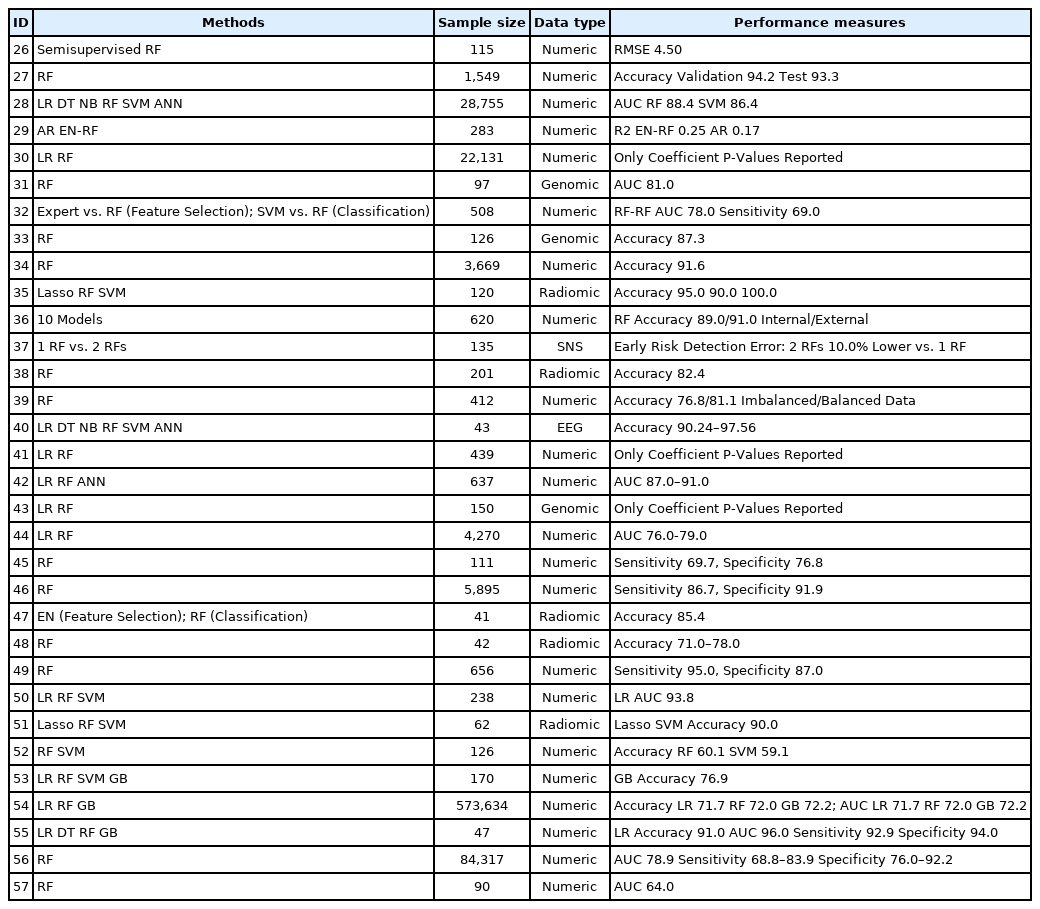
Summary of review: methods, sample size, data type and performance measures
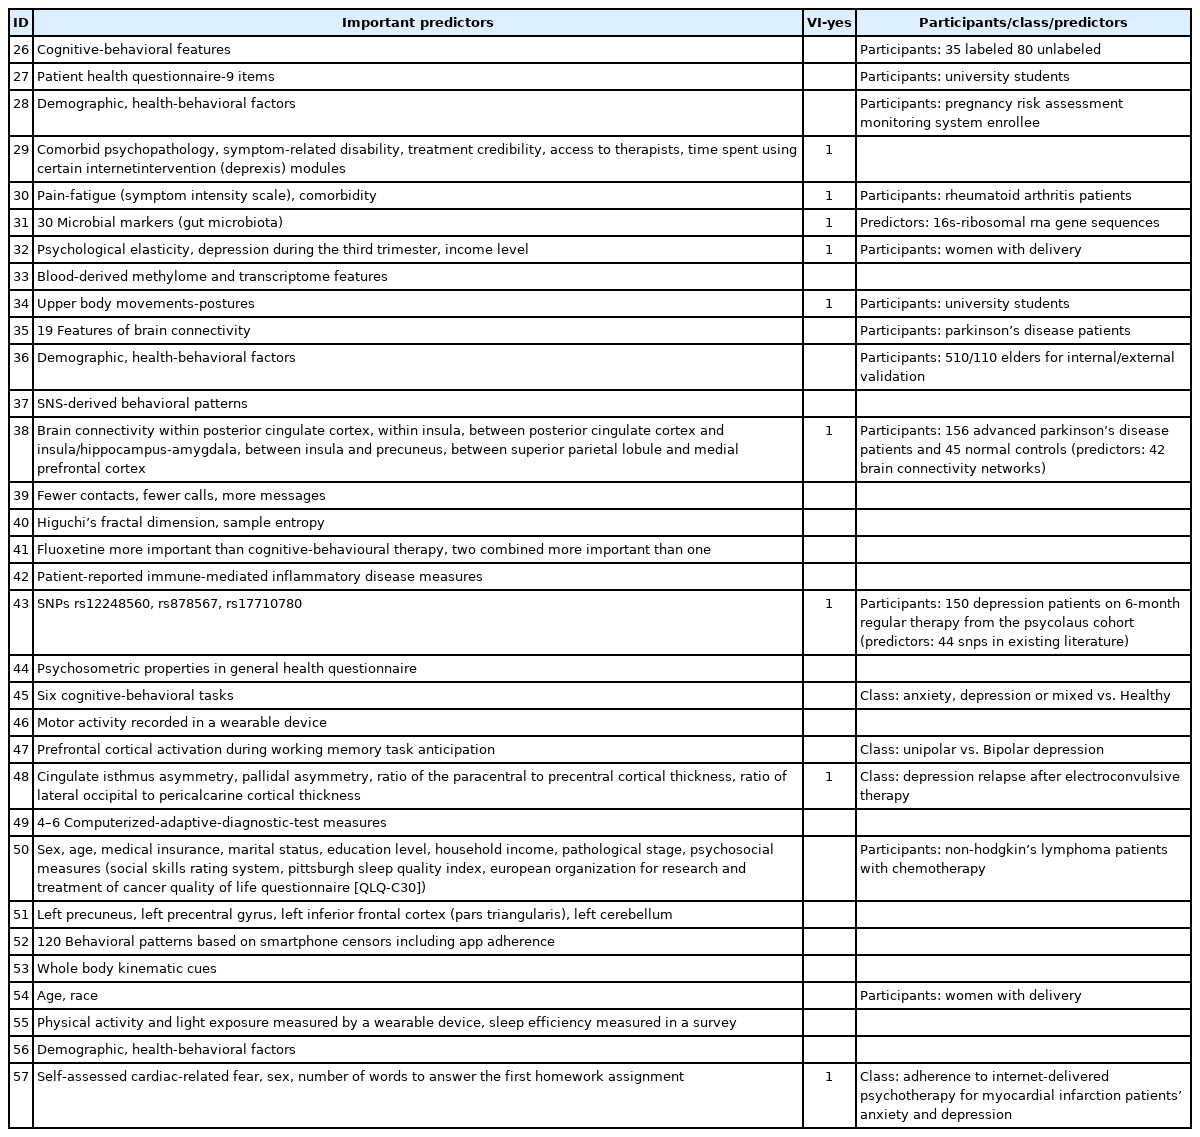
Summary of review: important predictors and whether variable importance (VI) is reported
Numeric data
The review of major studies with numeric data is presented in this section. The aim of a recent study [29] was to adopt numeric data and machine learning for analyzing the associations of depression with participant characteristics and 8-week internet intervention (Deprexis). The data came from 283 adults in the United States and their demographic, psychopathological, environmental and intervention variables were considered. The R2 performance of an ensemble with the elastic net and the random forest (0.25) were better than the auto-regressive model (0.17) for the prediction of post-treatment depression. Based on random forest VI, important predictors for the early diagnosis of depression were comorbid psychopathology, low symptom-related disability, treatment credibility, lower access to therapists and time spent using certain internet-intervention (Deprexis) modules. The contribution of a single predictor was small but the ensemble model with a rich collection of various predictors showed reasonable performance. Another study [30] employs numeric data and machine learning to identify important predictors for the early diagnosis of rheumatoid arthritis patients’ depression. The source of the data was 22,131 rheumatoid arthritis patients during 1999–2008 and their demographic, socioeconomic and health-related variables were included, especially, regarding pain-fatigue (Symptom Intensity Scale) and comorbidity. Most predictors were statistically significant in logistic regression but two predictors (pain-fatigue and comorbidity) were dominant in terms of random forest VI. This finding highlights the centrality of the two predictors regarding the clinical implication.
The early diagnosis of postpartum depression is a major issue in medicine and a recent study [32] builds two-stage machine learning methods to solve this issue, i.e., feature selection then depression diagnosis. The data came from a cohort of 508 women, the Edinburgh Postnatal Depression Scale within 42 days after delivery was used as the dependent variable, and their demographic, socioeconomic and health-related factors were considered as the independent variables. Four combinations of prediction models were used in this study: expert vs. random forest in feature selection; support vector machine vs. random forest in depression diagnosis. The random forest-random forest combination registered the best performance measures, AUC 78.0 and sensitivity 69.0. Psychological elasticity, depression during the third trimester and the income level ranked the top 3 in terms of random forest VI. The early diagnosis of depression for university students is another great challenge in health and another study [34] employs the random forest and China’s data on upper body movement alone (e.g., head posture, arm/body swing) to achieve the accuracy of 91.6. In a similar vein, low adherence to internet-delivered psychotherapy for myocardial infarction patent’s depression is an important research topic and a recent study [57] uses the random forest to identify important factors for the adherence. The source of the data was 90 myocardial infarction patients participated in Uppsala University Psychosocial Care Programme Heart study in Sweden. Adherence was defined as completing more than two homework assignments during 14-week therapy. The top-3 factors for the adherence were selfassessed cardiac-related fear, sex and the number of words to answer the first homework assignment. Examining a causal mechanism between linguistic factors and internet-delivered psychotherapy is expected to make a great contribution in this direction.
Genomic and radionomic data
The review of important studies with genomic and radiomic data is reported in this section. The aim of a recent study [31] is to adopt genomic data and machine learning for analyzing the effect of quetiapine treatment on microbiota and investigating the utility of microbiota as a biomarker for the diagnosis and treatment of bipolar depression (BD). Based on the results of univariate analysis for 16S-ribosomal RNA gene sequences, the composition of gut microbiota is significantly different between BD participants and their normal counterparts. Bacteroidetes and Firmicutes were dominant in BD patients and their normal counterparts, respectively. Quetiapine treatment for BD participants altered the composition of their gut microbiota. According to the findings of the random forest, 30 microbial markers were effective predictors of BD participants compared to their normal counterparts (AUC 81.0). This study concludes that quetiapine treatment would change the composition of gut microbiota and microbial markers would be effective for the diagnosis and treatment of BD. Likewise, another study [43] employed genomic data and the random forest to examine the effects of generic variants on major depressive disorder (depression hereafter) during 6-month regular therapy. The source of the data was 150 depression patients on 6-month regular therapy from the population-based PsyCoLaus cohort in Switzerland. The independent variables were 44 single nucleotide polymorphisms in existing literature. Among the 44 predictors, rs12248560, rs878567, and rs17710780 ranked the top 3 in terms of random forest VI. This study was a rare attempt to demonstrate that combining different types of data would break new ground for this area.
It is noteworthy to address recent innovations based on the combination of radiomic data and machine learning for the early diagnosis of depression. Depression is reported to be under-diagnosed in Parkinson’s disease patients, given that the two diseases are overlapped in their symptoms and it is very challenging to take accurate measures in old patients with Parkinson’s disease. In this context, a recent study [38] uses radiomic data and the random forest to highlight brain connectivity networks as effective predictors of depression among Parkinson’s disease patients. The data came from 156 advanced Parkinson’s disease patients and 45 normal controls. The independent variables were their 42 brain connectivity networks. Among the 42 predictors, the following networks ranked the top 6 in terms of random forest VI: 1) within posterior cingulate cortex; 2) within insula; 3/4) between posterior cingulate cortex and insula/hippocampus-amygdala; 5) between insula and precuneus; and 6) between superior parietal lobule and medial prefrontal cortex. The accuracy of the random forest was 82.4. This study concludes that brain connectivity networks would be useful predictors of depression among Parkinson’s disease patients based on radiomic data and machine learning. In a similar context, the focus of another study [48] was to improve the prediction of depression relapse after 6-month electroconvulsive therapy (which is reported to have a relapse rate higher than 50%). The source of the data was 42 depression patients with 6-month electroconvulsive therapy in the United States. Top predictors in terms of random forest VI were cingulate isthmus asymmetry, pallidal asymmetry, the ratio of the paracentral to precentral cortical thickness and the ratio of lateral occipital to pericalcarine cortical thickness (accuracy 71.0–78.0). Structural imaging features are expected to have great utility for the prediction of the prediction of depression relapse after 6-month electroconvulsive therapy.
DISCUSSION
This study presented one of the most comprehensive reviews regarding the recent progress of machine learning for the early diagnosis of depression. This study reviewed thirty two original studies out of 120 original studies in the Web of Science. Also, this study covered a wide range of summary measures, i.e., machine learning methods, sample size, data type, performance measures, important predictors, and whether the VI of the random forest is reported (VI-Yes 1). Current studies on the early diagnosis of depression based on machine learning has the following limitations. Firstly, many studies adopted cross-sectional data and employing longitudinal data would strengthen the performance of machine learning. Secondly, many studies used data with small sizes in single centers. Using big data (e.g., national health insurance claims data) would make valuable contributions for this area. Thirdly, most studies did not consider possible mediating effects among predictors. Fourthly, some studies reported accuracy or the AUC below 70.0 and these results would not be appropriate as diagnostic tests. Likewise, one study reported the accuracy of 100.0 and there could be overfitting in that study. Fifthly, binary categories (no, yes) are popular now but they can be refined to multiple categories with more clinical insights. Sixthly, combining different types of machine learning approaches for different types of depression data would bring new innovations in many aspects. Seventhly, this study compared the performance measures of the six machine learning methods only for different data types. How other data characteristics affect the performance measures of machine learning approaches would be an important topic for future research. In conclusion, however, this study demonstrates that machine learning provides an effective, non-invasive decision support system for early diagnosis of depression.
Notes
Availability of Data and Material
The datasets generated or analyzed during the study are available from the corresponding author on reasonable request.
Conflicts of Interest
The authors have no potential conflicts of interest to disclose.
Author Contributions
Conceptualization: Kwang-Sig Lee, Byung-Joo Ham. Data curation: Kwang-Sig Lee, Byung-Joo Ham. Formal analysis: Kwang-Sig Lee, ByungJoo Ham. Funding acquisition: Byung-Joo Ham. Investigation: Kwang-Sig Lee, Byung-Joo Ham. Methodology: Kwang-Sig Lee, Byung-Joo Ham. Project administration: Kwang-Sig Lee, Byung-Joo Ham. Resources: Byung-Joo Ham. Software: Kwang-Sig Lee, Byung-Joo Ham. Supervision: Kwang-Sig Lee, Byung-Joo Ham. Validation: Kwang-Sig Lee, Byung-Joo Ham. Visualization: Kwang-Sig Lee, Byung-Joo Ham. Writing—original draft: Kwang-Sig Lee, Byung-Joo Ham. Writing—review & editing: KwangSig Lee, Byung-Joo Ham.
Funding Statement
This study was supported by the National Research Foundation of Korea (NRF) funded by the Ministry of Education, Science and Technology (NRF-2020M3E5D9080792).