

INTRODUCTION
Major depressive disorder is considered to be a chronic, relapsing and remitting illness. A large percentage of patients (30-50%) fail to respond to an initial course of antidepressant treatment.1 Since a large number of patients fail to respond to antidepressants, there is a clear need for methods that determine the right treatment for the right patient.2 Repetitive transcranial magnetic stimulation (rTMS) has been proposed as one such option with its less invasive and less painful treatment process compared to electroconvulsive treatment.3,4 The establishment of the efficacy of rTMS has increased interest in finding potential predictors of clinical response. The value of clinical factors in predicting treatment outcome in major depressive disorder (MDD) is extremely limited and a shift towards biomarkers is evident. With the Personalized Medicine approach to depression, genetic and neuroimaging biomarkers have been explored and presented promising results in aiding treatment prediction using pre-treatment measures.5 Studies have been conducted primarily with neurophysiological electroencephalogram (EEG) biomarkers6,7 and functional neuroimaging biomarkers8,9 and demonstrated predictive effect of change of frontal quantitative EEG (QEEG) cordance in theta and delta frequency bands. Considerable number of research underline that the antidepressant medication effects are physiologically detectable in the EEG. QEEG cordance is one of the auspicious biomarkers used to predict the treatment response which has generated research interest. Cordance is a method of EEG spectra to yield values that have stronger correlation with regional cerebral perfusion. This correlation provides a physiological basis for interpreting this measure. The cordance calculation algorithm yields two indicators for each electrode site in each frequency band which are a categorical value (concordant or discordant state) and a numerical value.10
Several studies used pre-treatment EEG data to identify MDD subjects as responder or non-responder to rTMS treatment benefiting from statistical methods.5,8,10,11,13 A pilot study was presented to assess the utility of machine learning methods for processing EEG signals to predict the response of subjects to SSRI treatment12 and some studies worked on changes in QEEG prefrontal cordance as a predictor of response to antidepressants in patients with treatment resistant MDD.10 Various studies focused on the efficacy of rTMS and proposed as effective in treating MDD with minimal side effects.3
This study aims to examine whether an artificial intelligence approach, artificial neural network (ANN) using pre-treating frontal QEEG cordance is useful to predict the responder to rTMS treatment among MDD patients.
METHODS
Participants
The research was conducted in Neuropsychiatry Istanbul Hospital to predict the response to rTMS treatment in MDD by using the value of pre-treatment QEEG. The research has been formally approved by the local Medical Research Ethics Committee. This study was based on an open-label design. Patients who were willing to participate first visited a psychiatrist in order to assess if they met the inclusion criteria. All subjects were free of psychotropic medication for at least two weeks prior to enrollment. Subjects who met the Structured Clinical Interview for Diagnostic and Statistical Manual of Mental Disorders-IV (DSM-IV) criteria for major depressive disorder and determined by 17-item Hamilton Depression Rating Scale (HAM-D) score higher than 14 were eligible. Treatment-resistant depression was described as a failure to respond adequately to two successive courses of monotherapy with pharmacologically different antidepressants given in adequate doses for 4-6 weeks.
A total of 55 subjects completed the protocols and were examined for the present report. Choice of Selective Serotonin Reuptake Inhibitor (SSRI) antidepressant drug treatment was decided by their own treating physician, who remained responsible for dosing and any changes in medication during the study. Patients had taken part in a 3 week, 20 sessions of rTMS adjunctive to their medication regimen. All patients were on a monotherapy regimen. No patients were receiving lithium or mood stabilizer or benzodiazepines. A baseline clinical assessment was conducted in the day prior to rTMS treatment by a psychiatrist using the 17 item HAM-D. Patients were assessed twice during the study using clinical, neuropsychological and QEEG assessments. Routine laboratory studies (complete blood count, chemistry, thyroid stimulating hormone), urine toxicology screen, and electrocardiogram were performed at study screening, and subjects were required to be medically stable before enrollment to the study.
Patients with organic brain disorders as well as patients with pacemakers, any psychotic symptoms, dementia, delirium, substance-related disorders, cluster A or B Axis II disorders, patient treated with electroconvulsive therapy (ECT) in the prior six months, patients having any past history of craniotomy, skull fracture, seizures, or significant neurological illness and the ones who had past history of suicidal intent, plan, or attempt were ineligible (exclusion criteria).
Cordance and EEG recordings
The EEG cordance method was originally developed by Leuchter and colleagues14 to provide a measure, which had face validity for the detection of cortical differentiation. They observed that often the EEG over a white-matter lesion exhibited decreased absolute theta power, but increased relative theta power, termed as "discordant". Therefore the EEG cordance method combines absolute and relative EEG power, and negative values of this measure (discordance)-specifically in theta or beta-are believed to reflect low perfusion or metabolism, whereas positive values (concordance)-specifically in alpha-are thought to reflect high perfusion or metabolism. In a subsequent study it is confirmed by comparing cordance EEG with simultaneously recorded PET scans reflecting perfusion.15 In order to observe and reveal the efficacy of cordance, pre-treatment QEEG data were collected from 55 MDD subjects who were instructed to rest in the eyes-closed, maximally alert state, in a quiet room with subdued lighting. The researchers monitored the QEEG data during the recording and re-alerted the subjects every minute as needed to avoid drowsiness. Three minutes of eye-closed EEG at rest were acquired using Scan LT EEG amplifier and electrode cap (Compumedics/Neuroscan, USA) with the sampling rate of 250 Hz. 19 sintered Ag/AgCl electrodes positioned according to the 10/20 International System with binaural reference. The data from 6 frontal electrodes (Fp1, Fp2, F3, F4, F7, and F8) in slow bands (delta and theta) were used in this study. Raw EEG signal was filtered through a band-pass filter (0.15-30 Hz) before artifact elimination. Manually selected (minimum 2 minutes) artifact-free EEG data which has minimal split-half reliability ratio of 0.95 and test-retest reliability ratio of 0.90 were used for cordance calculations. Prior to calculate absolute and relative power values, electrode referencing was adopted to the bipolar electrode pairs for cordance.16 Fast-Fourier-Transform was used to calculate absolute and relative power in each of two non-overlapping frequency bands: delta (1-4 Hz) and theta (4-8 Hz) by using NeuroGuide Deluxe 2.5.1 software (Applied Neuroscience; St. Petersburg, FL). Cordance values are calculated using a custom software in MATLAB and is based on three consecutive steps in the processing of power values. The steps are; reattribution of power from bipolar pairs of electrodes to individual electrodes, spatial normalization of absolute and relative power across brain areas and characterization of the association between normalized absolute and relative power measures.15
rTMS session procedures and ratings
rTMS was applied using the Magstim Super Rapid2 stimulator (Magstim Company, Whitland, UK) with figure-of-eight shaped Air Film Coil in all patients in an open-label manner. The rTMS intensity was set at 100% of the motor threshold which was determined by visual inspection. Stimulations were given to the left prefrontal cortex, deemed to be located anterior to the cortical motor area of the abductor pollicis brevis of which the motor threshold was determined. The treatment schedule was six days in a week, from Monday to Saturday for three weeks. 25 Hz stimulation with the duration of 2 seconds was delivered 20 times with 30-second intervals.17 A full course comprised 1000 magnetic pulses.
Depressive symptom changes were measured by validated Hamilton Depression Rating Scale.18 The primary outcome parameter, the 17-item HAMD (HAMD-17) score, constitutes a valid and reliable measure of the severity of depressive symptoms.
The HAMD-17 scores were obtained at baseline and 1-week after completing the course of rTMS. For research purposes, the HAM-D percentage change value is discretized into two values (or classes), corresponding to responder (R) when it is larger than or equal to 50%, and non-responder (NR) otherwise.11
Artificial Neural Network and modeling
Artificial Neural Networks are gross simplifications of real (biological) networks of neurons.19 Inspired by the structure of the brain, a neural network consists of a set of highly interconnected entities, called nodes. Each node is designed to copy its biological counterpart, the neuron. Each accepts a weighted set of inputs and responds with an output. Neural networks are widely used for system identification and control, pattern recognition, medical diagnosis, data mining, decision making and nonlinear system modeling applications. ANN training method is an adaptive process enables computers to learn from experience, learn by example, and learn by analogy. Learning (training) is a process in which the network adjusts its parameters in response to input stimuli so that the model response converges to the reference. The use of machine learning tools in medical diagnosis is increasing rapidly. This is mainly because of the effectiveness of classification and recognition systems to support medical experts in diagnosing diseases.20 For modeling process, feed-forward neural network trained by a backpropagation algorithm is used. The network is based on the supervised procedure, i.e. the network constructs a model based on examples of data with known outputs. The architecture of the network is a layered feed-forward neural network, in which the non-linear elements (neurons) are arranged in successive layers, and the information flows unidirectionally, from input layer to output layer, through the hidden layer(s).21
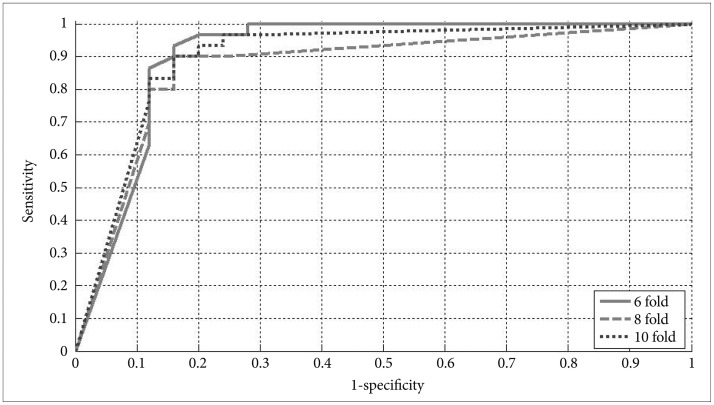
Input data is collected from six electrodes in two slow bands as QEEG cordance, 10 neurons were used in hidden layer, sigmoid transfer function used in each neuron because of its nonlinear behavior and trainlm training function was used in MATLAB and k-fold cross validation was performed to train and test the classifier. In order to evaluate the classification algorithm Receiver Operating Characteristic (ROC) curve, a plot of the sensitivity (true positive rate) as the function of false positive rate (1-specificity) was used.
RESULTS
In this study, 55 MDD patients consisted of 30 responders and 25 non-responders based on the variations of HAMD-17 scores. The classification task was performed using the neural network (NN) based classifier which managed input data of QEEG cordance. The classification results are given in Table 1 for various ╬║ values of cross validation. For each training, the number of true positive (TP), false negative (FN), true negative (TN) and false positive (FP) subjects were also given to evaluate the performance of classification.
NN identified Responder and Non-Responder subjects with 89.09%, 85.45% and 87.27% overall accuracies for 6, 8 and 10 ╬║ values, respectively. NN based classifier reached to 93.33% Responder subjects' detection sensitivity with 4FPs using 6-folds and 5 FPs using 10-folds. Using 8-fold cross validation, NN classifier yielded 86.67% responder classification sensitivity with 4 FPs. 6-fold and 8-fold cross validation were stating 84% specificity while 10-fold cross validation signed 80% specificity.
DISCUSSION
The primary aim of this study is to examine whether pre-treating frontal QEEG cordance can be a factor to predict a response to rTMS treatment among MDD patients by using the ANN based model. Previous studies, focusing on several EEG variables, classified responder and non-responder subjects using anterior individual alpha peak frequency, fronto-central theta, pre-frontal cordance in the delta and beta bands and P300 amplitude as a predictor.5 Some other studies using theta frontal cordance found positive correlation between responders group and decline of frontal cordance after treatment.2,10 Frontal electrical activity in theta frequency band has been associated with the function of these structures and previous research has linked pretreatment theta activity of the anterior cingulate with clinical response.5,12 The results of our study support the former clinical researches and focus on the prefrontal region and theta frequency band for MDD patients. Another study focused on the correlations between clinical response (after four weeks) and EEG features including individual alpha power (8-13 Hz), alpha frequency as well as asymmetry indexes in depressed subjects. Their analysis found that there was weak evidence of predicted correlation between these features and clinical rating change while few studies to date using EEG data and employing traditional clinical data analysis have shown limited ability to predict response to rTMS treatment.6 On the other hand, combining various biomarkers, many other statistical methods were used to classify MDD subjects as responder or non-responder to rTMS treatment process.5,8,10,11,13 Numerous studies have compared the classification performance of ANNs with traditional statistical techniques and provided evidence to suggest that ANNs outperform traditional techniques for some cases.22,23,24 This is not surprising since standard statistical techniques represent a subset of the models that can be approximated by the ANNs.25 The machine learning paradigm has also been applied to a study using ANN fed with EEG data to differentiate three classes of subjects: those with schizophrenia, those with depression, and healthy subjects.26 A recent study also used a technique known as Support Vector Machines to develop models able to identify digital EEG signal dataset patterns from probands previously diagnosed as controls or Alzheimer's disease patients.27 In order to advance the learning speed and generalization performance of the network, extreme learning machine approach was used in another classification application and achieved a satisfactory classification rate.28
We studied ANN for slow bands using frontal pre-treatment QEEG cordance, evaluated the classification performance using ╬║-fold cross-validation procedure with 6, 8 and 10 ╬║ values, and obtained 89.09% overall classification accuracy and the AUCs for responder detection using 6-fold cross validation was 0.917. In comparison, a similar study using Antidepressant Treatment Response obtained an ROC of 0.7729 and in another research, an ROC area of 0.76 was obtained by using theta cordance.30 Compared to these AUC values, the obtained area of 0.917 can be considered remarkable, especially taking into account that this study only investigated measures assessed at baseline instead of a treatment-emergent biomarker such as Antidepressant Treatment Response.
Our findings support the potential utility of ANN approach method to be used as a clinical tool in administering rTMS therapy to a targeted group of subjects suffering from MDD. This methodology is more potentially useful to the clinician as prediction is possible using EEG data collected before this treatment process is initiated. Since the number of subjects in this study is small, further evaluation is recommended for a much larger sample group before any definitive conclusions are drawn. And since the early prediction process performance of rTMS treatment is related to artificial neural network approach, feature optimization using optimization algorithms is another promising approach contributing to the performance of modeling process.