


INTRODUCTION
Late-life depression is an essential public health issue worldwide. It deserves attention because it is the cause of suffering, family disruption, disability, worsening of medical conditions, and increase in mortality [1-3]. Globally, the prevalence of major depression in older adults is reported to be 13.3% [4]. Latelife depression has also become a critical problem in the Republic of Korea owing to the rapidly aging population. In 2019, Korean adults aged 65 or more accounted for 15.5% of the total population, and this number is speculated to escalate to 25.5% in 2030 and 34.3% in 2040 [5,6]. Among this large population of older adults, the reported prevalence of late-life depression is approximately 15%, and it can get as high as 33% [7,8].
In some studies, it is demonstrated that unemployment leads to depression in older adults and impairs mental health [9,10]. Correspondingly, another study revealed that older adults who worked experienced fewer depressive symptoms, better mental well-being, and higher life satisfaction than retirees [11]. The same applies to late-life depression in the Republic of Korea. Studies based on Korean National Health and Nutrition Examination Survey showed that being employed is associated with a low prevalence of depression in older adults [12,13]. It is interesting to note that participation of older adults in senior employment programs is associated with low depressive symptoms [14,15]. In the Republic of Korea, the Senior Employment and Social Activity Support Program was launched in 2004 to guarantee supplementary income and promote social participation among older adults aged 65 or more. The program developed, and, in 2020, the number of accumulated participants was 840,673 [16]. The majority of jobs that participants engaged in entailed working for public facilities including public health centers, welfare facilities, childcare centers, and libraries. Other jobs involved caring for people with lack of social support such as vulnerable elderly and the handicapped. The mean of monthly income was approximately 474,200 won.
Although there are pre-existing studies that imply that a senior employment program is associated with low depressive symptoms [14,15], the association has only been studied in a few research with lack of comparison with non-senior employment program jobs. Additionally, despite the point that considering income level is important when examining this relationship, analysis according to income level has not been yet performed. Owing to the point that most jobs of the program provide low income, to observe the association between senior employment programs and geriatric depressive symptoms, senior employment program jobs and non-senior employment program jobs should be compared according to the income level. The relationship between the income level and late-life depression is controversial. It is indicated that low income is associated with depression in old age [17]. According to another study, the prevalence and persistence of depressive symptoms in older adults were associated with socio-economic disadvantage [18]. Similarly, it is also demonstrated that higher socio-economic status was a protective factor for emotional health in older adults [19]. However, another study found that low income was not a risk factor for major depressive disorder in individuals aged 65 years or more [20].
Therefore, in the present study, we aimed to elucidate the association between geriatric depressive symptoms and government-initiated senior employment program (GSEP) jobs by analyzing 1) the association between being employed and geriatric depressive symptoms, 2) the association between the income level and geriatric depressive symptoms, 3) the association of GSEP employment status (unemployed, nonGSEP jobs, GSEP jobs) with geriatric depressive symptoms, and 4) the association of GSEP employment status (unemployed, non-GSEP jobs, GSEP jobs) with geriatric depressive symptoms based on income levels. We also aimed to identify whether a certain factor (general depressive affect, life satisfaction, withdrawal) of the geriatric depressive symptoms was especially associated in particular [21]. A path diagram that depicts the hypotheses of this study is provided in Supplementary Figure 1 (in the online-only Data Supplement). We expect that clarifying the association between GSEP jobs and geriatric depressive symptoms compared to non-GSEP jobs according to the income level will provide insights in implementing government policies and interventions regarding senior employment program and geriatric depression in public health aspect.
METHODS
Study population and recruitment
In this study, the participants of the Living Profiles of Older People Survey (LPOPS) 2020 were chosen, who were 10,097 individuals aged 65 years or older. LPOPS is a nationwide inspection held every 3 years, starting from 2008. LPOPS 2020 is the fifth survey and was conducted from September 14, 2020 to November 20, 2020. We excluded 810 participants, leaving only 9,287 for analysis (Figure 1). Individuals related to cognitive decline or missing in value (n=615), disability affecting survey response (n=87), missing in the main outcome (geriatric depressive symptoms) (n=0), missing in covariates (n=95), and missing in the main exposure (employment status, GSEP, the income level) (n=13) were excluded.
To assess cognitive decline, Mini Mental State Examination-Dementia Screening (MMSE-DS) score was used [22]. The cut-off was “mean-2*standard deviation (13.702).” Thus, participants with MMSE-DS score of 13 or below (n=403) were excluded, and those with missing values of MMSE-DS score (n=212) were also excluded. Next, those with disabilities affecting survey response were excluded, including brain lesion (n=20), hearing (n=60), language (n=3), and intellectual disabilities (n=4). None were missing in the main outcome, which were geriatric depressive symptoms. Those missing in covariates (n=95) were excluded, which were those missing in quartiles of an asset. Lastly, those missing in the main exposure (employment status, GSEP, the income level) (n=13) were excluded, which were those missing in the income level.
The study was approved by the Institutional Review Board of Ajou University Hospital (AJOUIRB-EX-2023-016). At the time of the survey, written informed consent was obtained from all participants.
Study assessments
Geriatric depressive symptoms
Geriatric depressive symptoms were the main outcome measured by the Korean version of the 15-item Geriatric Depression Scale (SGDS-K) [23,24]. This scale is composed of 15 binary questions about depressive and non-depressive symptoms. After oppositely converting scores of questions about non-depressive symptoms, the scores were added up. The full score was 15, and higher scores meant higher degree of geriatric depressive symptoms.
For analyzing three factors of geriatric depressive symptoms, excluding question #10, the rest 14 questions were classified into three groups: general depressive affect (factor 1: question #3, #4, #6, #8, #12, #14, #15), life dissatisfaction (factor 2: question #1, #5, #7, #11), and withdrawal (factor 3: question #2, #9, #13) [21]. The SGDS-K score of each factor was estimated by adding up scores of questions belonging to each factor. In this study, we named the second factor “life dissatisfaction” instead of “life satisfaction” because scores of nondepressive symptoms were converted oppositely.
Employment status, GSEP, and income level
Employment status, GSEP, and the income level were the main exposure. First, we studied the association between being employed and geriatric depressive symptoms by classifying participants into those who were currently unemployed and those who were currently employed. Participants who answered that they have worked in the past but are not working in the present and those who answered that they have never worked in their whole life were classified as those who were currently unemployed. Participants who answered that they were working in the present were classified as those who were currently employed. Among total 9,287 participants in this study, 5,692 (61.3%) participants were currently unemployed, and 3,595 (38.7%) participants were currently employed.
Second, we studied the association between the income level and geriatric depressive symptoms by classifying participants into four groups according to the level of average monthly income. First, we set aside those who were currently unemployed as a separate group. Second, we classified the rest into tertiles of approximately equal numbers of participants (1,180, 1,162, and 1,253, respectively) according to the level of average monthly income. Thus, the first group was those who were currently unemployed. The second group was those whose income level belonged to the lower tertile, which was from 10,000 to 680,000 won (approximately 7 to 472 US dollars). The third group was those whose income level belonged to the middle tertile, which was from 700,000 to 1,750,000 won (approximately 486 to 1,215 US dollars). The fourth group was those whose income level belonged to the upper tertile, which was from 1,800,000 to 50,000,000 won (approximately 1,249 to 34,702 US dollars). The number of participants in each group was 5,692 (61.3%), 1,180 (12.7%), 1,162 (12.5%), and 1,253 (13.5%), respectively.
Third, we examined the association between GSEP and geriatric depressive symptoms by classifying participants into three groups. The first group was those who were currently unemployed. The second group was those who engaged in jobs that were not part of GSEP and included employers, own-account makers, unpaid family workers, regular employees, temporary employees, and daily employed workers who did not engage in GSEP. Non-GSEP jobs were mostly comprised of farming, fishing, cleaning, and cooking. The third group was those who participated in GSEP and included regular employees, temporary employees, and daily employed workers who engaged in GSEP. As previously mentioned, GSEP jobs mostly involved roles at public institutions and assisting individuals with limited social support. The number of participants in each group was 5,692 (61.3%), 2,927 (31.5%), and 668 (7.2%), respectively.
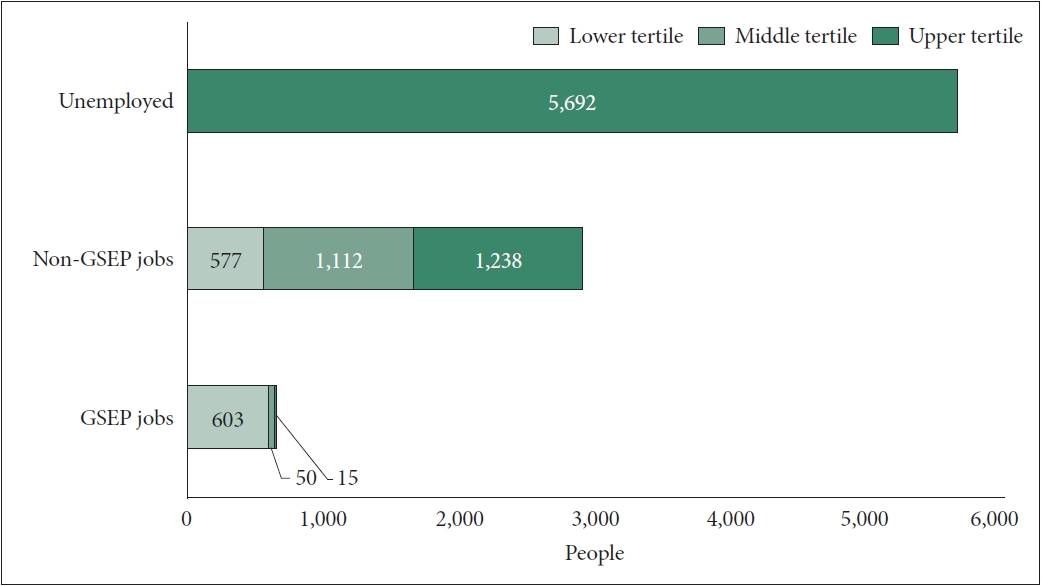
Lastly, we classified the participants into seven groups according to both GSEP and the income level. The first group was currently unemployed participants. The second, third, and fourth groups engaged in non-GSEP jobs and their income level belonged to the lower, middle, and upper tertiles, respectively. The fifth, sixth, and seventh groups engaged in GSEP jobs and their income level belonged to the lower, middle, and upper tertiles, respectively. The number of participants in each group was 5,692 (61.3%), 577 (6.2%), 1,112 (12.0%), 1,238 (13.3%), 603 (6.5%), 50 (0.5%), and 15 (0.2%), respectively (Figure 2).
Covariates
Covariates in this study were age, sex, area of residency, years of education, nutrition status, quartiles of asset, frequency of alcohol consumption, smoking, number of chronic diseases, and cognitive function.
In assessing the area of residency, town and township were classified as rural, while the neighborhood was classified as urban. Nutrition status was assessed by “Determine Your Nutrition Health” checklist by Nutrition Screening Initiative. This checklist consists of twelve binary questions about nutritional management during the latest month. We converted “yes” to 1 point, and “no” to 0 point and added them up. The full score was 12, and higher scores meant poorer nutritional status.
The asset was estimated by adding real estate, financial, and other assets and then subtracting debt. Quartiles were divided into approximately equal numbers (2,321, 2,316, 2,342, and 2,308, respectively). The lower quartile was from -499,000,000 to 70,780,000 won (approximately -346,200-49,106 US dollars), the middle quartile from 70,870,000 to 159,040,000 won (approximately 49,169-110,340 US dollars), the upper quartile from 160,000,000 to 300,000,000 won (approximately 111,006-208,136 US dollars), and the fourth quartile from 301,500,000 to 6,000,000,000 won (approximately 209,177-4,162,721 US dollars).
The frequency of alcohol consumption was divided into three groups: no consumption during the latest year, more than once a year to once a week, and 2-3 times a week to everyday. The number of chronic diseases were number of chronic diseases that were diagnosed by a doctor. This included cardiovascular diseases, endocrine diseases, musculoskeletal diseases, pulmonary diseases, neuropsychiatric diseases, eye diseases, ear diseases, dermatologic diseases, cancers, gastrointestinal diseases, genitourinary diseases, and other diseases.
Cognitive function was assessed by MMSE-DS score [22]. MMSE-DS consists of items testing orientation, memory registration, recollection, concentration, naming, language, understanding, and judgment. The full score was 30, and higher scores meant higher cognitive function.
Statistical analysis
We present continuous variable data as the mean along with the standard deviation (SD). When comparing continuous variables between groups, we selected either the Student’s t-test or the Mann-Whitney U test, depending on the normal or non-normal distribution of variables. For comparisons involving three groups, we chose either the analysis of variance test or the Kruskal-Wallis test, again based on the variable distribution. We represented categorical variables as percentages and the number of study participants. To discern differences between categorical variables, we employed either the chi-squared test or Fisher’s exact test. Geriatric depressive symptoms measured by the total SGDS-K score were considered as a continuous variable. General depressive affect, life dissatisfaction, withdrawal measured by SGDS-K scores of each factor were also considered as continuous variables. We performed multiple linear regression analyses to examine the significance of associations between geriatric depressive symptoms and employment status, income level, and non-GSEP or GSEP jobs. The goodness of fit of the regression model was confirmed by the Durbin-Watson statistics. The variance inflation factor was used to detect multicollinearity in regression model. A p-value<0.05 was the standard for statistical significance. Data were analyzed by the Statistical Package for Social Sciences (IBM SPSS Statistics 28.0; IBM Corp., Armonk, NY, USA).
RESULTS
Baseline characteristics
The mean age of the participants was 73.2 (standard deviation [SD]=6.4). Of the 9,287 participants, 3,739 (40.3%) were men and 5,548 (59.7%) were women. The mean total SGDS-K score (indicating geriatric depressive symptoms) was 3.22 (SD=3.26). We further stratified geriatric depressive symptoms into three distinct dimensions: general depressive affect (factor 1), life dissatisfaction (factor 2), and withdrawal symptoms (factor 3). The mean scores for general depressive affect, life dissatisfaction, and withdrawal were 0.88 (SD=1.54), 1.34 (SD=1.42), and 0.86 (SD=0.91), respectively. More detailed information is provided in Table 1.
Association between employment status and geriatric depressive symptoms
Employment status was significantly associated with the reduction of geriatric depressive symptoms. Specifically, being employed, compared to being unemployed, was linked to a decrease in overall geriatric depressive symptoms (β=-0.639, 95% confidence interval [CI]=-0.767 to -0.511, p<0.001). Employment was also significantly associated with a decrease across all three factors of geriatric depressive symptoms: general depressive affect (factor 1, β=-0.171, 95% CI=-0.232 to -0.110, p<0.001), life dissatisfaction (factor 2, β=-0.252, 95% CI=-0.313 to -0.190, p<0.001), and withdrawal (factor 3, β=-0.188, 95% CI=-0.225 to -0.151, p<0.001). More detailed information is provided in Table 2.
Association between the income level and geriatric depressive symptoms
For all income tertiles, being employed was associated with reduced geriatric depressive symptoms compared to unemployment (β of lower, middle, and upper tertiles=-0.753, -0.547, and -0.583, respectively, and p<0.001 for all tertiles).
Regarding three factors of geriatric depressive symptoms, an intriguing pattern surfaced within factor 2, life dissatisfaction. The employed group with lower income (lower tertile) showed a marked decrease in life dissatisfaction (factor 2, β=-0.388, 95% CI=-0.474 to -0.302, p<0.001). The 95% CI for this group did not overlap with those of the middle and upper tertiles, signifying a distinct trend. More detailed information is provided in Table 3.
Association of GSEP employment status (unemployed, non-GSEP jobs, GSEP jobs) with geriatric depressive symptoms
Upon comparing unemployed older adults, non-GSEP jobs, and GSEP jobs regarding geriatric depressive symptoms, those in GSEP jobs exhibited a distinct reduction in depressive symptoms (β=-0.968, 95% CI=-1.196 to -0.739).
Regarding three factors of geriatric depressive symptoms, individuals in GSEP jobs demonstrated a more considerable reduction in life dissatisfaction (factor 2, β=-0.475, 95% CI= -0.584 to -0.366). However, this trend was not evident in general depressive affect (factor 1) and withdrawal symptoms (factor 3). More detailed information is provided in Table 4.
Association of GSEP employment status (unemployed, non-GSEP jobs, GSEP jobs) with geriatric depressive symptoms based on income levels
Two groups of GSEP jobs, whose income level belonged to the middle and upper tertiles, had notably small numbers of group members (50 and 15, respectively). Due to these small sample sizes, these groups were not included in further interpretation and analysis.
In an analysis of geriatric depressive symptoms among unemployed older adults, non-GSEP job workers, and GSEP job workers stratified by income level, it was found that older adults engaged in GSEP jobs in the lower income tertile experienced significant lower depressive symptoms (β=-1.027, 95% CI=-1.266 to -0.787).
With respect to the three factors of geriatric depressive symptoms, older adults in lower tertile GSEP jobs showed a marked reduction in life dissatisfaction (factor 2, β=-0.510, 95% CI=-0.625 to -0.396). However, this trend was not evident in general depressive affect (factor 1) and withdrawal symptoms (factor 3). More detailed information is provided in Table 5.
DISCUSSION
Based on the results of our study, the following four key points can be drawn: 1) Being employed was associated with significant lower geriatric depressive symptoms in comparison to being unemployed. This effect was consistent across all three factors of geriatric depressive symptoms: general depressive affect, life dissatisfaction, and withdrawal. 2) Regardless of income levels, employment status was associated with lower geriatric depressive symptoms; especially, individuals with lower income tertile notably experienced less life dissatisfaction. 3) Participants in the GSEP showed less geriatric depressive symptoms, particularly life dissatisfaction, highlighting the potential benefits of government-initiated program on senior mental health. 4) Finally, older adults in lower income tertile GSEP roles displayed significantly lower depressive symptoms and life dissatisfaction, despite their limited income. This underlines the considerable effectiveness of GSEP in enhancing mental health outcomes, even among those individuals with lower income.
Our first and second findings shed light on the significant role of employment in the mental health of older adults. Regardless of income level, being employed was associated with a reduction in geriatric depressive symptoms, including general depressive affect (factor 1), life dissatisfaction (factor 2), and withdrawal (factor 3). This association underscores the profound importance of maintaining active employment in geriatric mental health management, suggesting that engaging in work, irrespective of the income earned, provides a sense of purpose and structure that can alleviate depressive symptoms in older adults [9-13]. The results imply that factors beyond income, such as job satisfaction, social interactions, or a sense of self-worth from being employed, may play a considerable role in affecting life satisfaction [25,26]. This observation adds a new facet to our understanding of mental health in older adults, challenging traditional notions that higher income always leads to better mental health outcomes. These findings emphasize the need for further studies to unravel the complex interplay between employment, income level, and mental health.
From our third and fourth findings, we discerned the substantial impact of the GSEP on the mental health of older adults. Our data showed that participants in GSEP reported fewer geriatric depressive symptoms, especially a reduced sense of life dissatisfaction. This suggests that GSEP’s potential influence extends beyond the mere provision of employment and income, potentially offering a supportive work environment, fostering social engagement, and bestowing a sense of security and dignity that may contribute significantly to enhancing life satisfaction [27,28]. Interestingly, despite being in the lower income bracket, GSEP participants reported markedly lower depressive symptoms and less life dissatisfaction. This observation underscores the effectiveness of GSEP in improving mental health outcomes, even amongst lower-income individuals. We hypothesize that this can be attributed to the striking similarities between GSEP jobs and volunteering activities [14]. Various studies have shown that, amongst older adults, volunteering is linked to fewer depressive symptoms, increased well-being, life satisfaction, and overall positive health outcomes [29-31]. This suggests that older adults may engage in GSEP jobs driven more by intrinsic motives than financial incentives. Such motivations could explain why lower-income GSEP participants were associated with fewer geriatric depressive symptoms. This hypothesis is further supported by a study suggesting that intrinsic motives, when participating in bridge employment, are associated with higher life satisfaction compared to financial motives [32]. This compelling outcome highlights the significant role of the quality and nature of employment, beyond its mere availability, in shaping mental health outcomes in the elderly. Moreover, it underscores the potential for government-initiated programs like GSEP to serve as effective tools for enhancing the mental health of seniors, particularly in resource-limited settings. Hence, our findings underscore the need for policy measures to not only focus on providing employment but also on ensuring the quality of job opportunities offered to the elderly, particularly those in the lower income bracket.
The strength of this study is that it is based on LPOPS, a large-scale population-based study. Furthermore, we not only studied geriatric depressive symptoms in general but also three factors of geriatric depressive symptoms, which are general depressive affect, life dissatisfaction, and withdrawal. However, this study also has some limitations. Differences between groups other than the reference group (unemployed) was not strictly statistically verified, limiting interpretation. Also, the cross-sectional design of our study may limit the generalizability of our findings to longitudinal settings, where the relationships between variables may be different. In addition, although we attempted to control for the effects of several confounding variables, there may still have been unmeasured confounders that we were unable to account for. Finally, we must note that our study did not sufficiently reflect certain aspects of GSEP, such as the actual working hours, the exact working environment, and the nature of the work involved. Therefore, future studies need to consider these factors for a more comprehensive understanding of the potential benefits and impacts of GSEP on the mental health of older adults.
In conclusion, our study underlines the significant role of employment and the unique impact of the GSEP in reducing depressive symptoms among older adults. We found that employment, regardless of income levels, was associated with fewer geriatric depressive symptoms, and interestingly, individuals in the lower income tertile reported less life dissatisfaction. GSEP participation, remarkably, led to reduced depressive symptoms and life dissatisfaction, even among those in lower income tertile. Given these findings, it’s vital that future studies further explore these relationships, incorporating additional parameters like actual working hours and job nature in the context of GSEP, and apply longitudinal designs for a comprehensive understanding of GSEP’s potential benefits on the mental health of older adults. These efforts will provide valuable insights to shape future policies and interventions aimed at enhancing mental health outcomes in older adults.