


INTRODUCTION
Depression is a prevalent mental health disorder worldwide, affecting people of all ages, genders, and socio-economic backgrounds. According to the World Health Organization, an estimated 3.8% of the global population is affected by depression, the leading cause of disability worldwide [1]. The prevalence of depression varies across countries, with some regions experiencing higher rates than others. In South Korea, the prevalence of depression is estimated to be around 5.7%, accompanied by some of the highest suicide rates in the world [2]. Although early diagnosis and treatment are crucial to improve patient outcomes of depressive disorder, according to a 2020 survey conducted in South Korea, only 11.5% of individuals with a mental disorder received a diagnosis, and the majority of those who did not seek help cited stigma and fear of discrimination as the main barriers [2].
One significant limitation to current depression diagnosis is the lack of objectivity in assessment methods. Currently, diagnosis is based primarily on self-reported symptoms and clinician diagnostic interviews, which can be subject to bias and error. Moreover, these methods may not fully capture the complexity of depression, including the individual variability in symptom presentation and response to treatment [3]. The lack of objective biomarkers or physiological measures for depression also presents a challenge in developing accurate and reliable diagnostic tools. Efforts to incorporate objective measures in psychiatric diagnosis have been ongoing for several years, with the aim of improving diagnosis and treatment. Not only biomolecules such as cortisol, cytokines, and neurotransmitters, but also various neuroimaging techniques like functional magnetic resonance imaging, positron emission tomography, and electroencephalography are increasingly being studied as means to observe altered neural activity in specific brain regions [4]. However, according to a recent meta-analysis, only cortisol has been investigated as a marker that can predict the onset, relapse, and recurrence of major depressive disorder [5].
Cortisol is the end-product of the hypothalamic-pituitary-adrenal (HPA) axis, a system involved in the stress response [6,7]. When stress becomes chronic, the HPA axis can dysfunction and is known to play an important role in the pathophysiology of depression [8]. A non-suppression result on the dexamethasone suppression test, which reflects hyperactivity of the HPA axis, is a classic indicator of depression [9,10]. The underlying reason is that the negative feedback system is disrupted due to downregulation of glucocorticoid receptor (GR) in the hippocampus and hypothalamus due to chronic stress [11]. However, dysfunctional reactivity of the HPA axis could not be found consistently in studies of patients with major depressive disorder [12,13].
The cortisol awakening response (CAR) refers to changes in cortisol level, which cycles from the time you wake up in the morning until about 1 hour later [14]. The CAR indicates the reactivity of the HPA axis to natural challenges in the awakening process, and it has been studied and used as a biomarker of the function of the HPA axis in recent years [15-17]. The CAR also has value as a diagnostic biomarker in that it reflects unified stress and time conditions [15]. Considering CAR in the context of depression, studies have shown heterogeneous activity, with hypoactivity in the severe depression group and hyperactivity in the acute and mild-to-moderate depression groups, creating an inverted U-shape [18]. Another study showed that patients with low CAR had a chronic, unfavorable course of depression [19]. Based on these findings, it can be inferred that HPA axis function in depressed patients shows hyper-responsivity in the acute stress phase but an exhausted response in the chronic phase and can be used as a biomarker.
On the other hand, in depression evaluation, current psychological assessment scales consist of questionnaires that focus primarily on depressive symptoms [20,21]. However, assessing protective and vulnerability factors in addition to the surface symptoms of depression can provide more information about disease chronicity and severity and suggest tailored treatment regimens for individual patients [22-25].
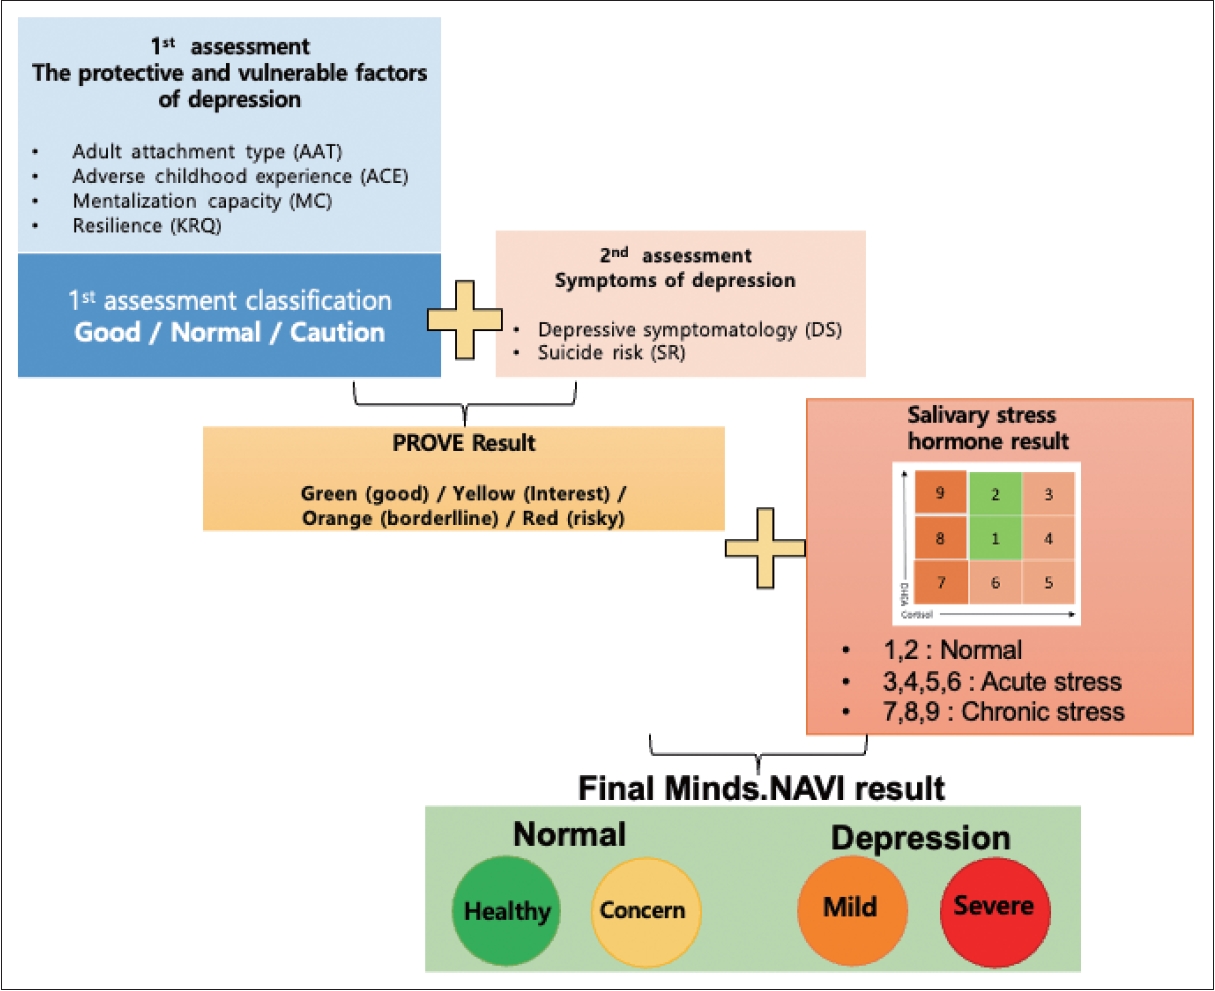
We developed the Minds.NAVI kit, which is an assistant diagnostic software program, through a holistic assessment that encompasses a comprehensive biopsychosocial evaluation, including psychological and biological markers. Minds.NAVI is an automatic integrative assessment software that can help clinicians to diagnose depression by integrating the results of the psychological assessment battery, which combines current symptoms of depression, protective and vulnerable factors (PROtective and Vulnerable factors battEry Test [PROVE]), and the functional stage of the HPA axis through the assessment of cortisol and dehydroepiandrosterone (DHEA) in saliva. In this study, we conducted an exploratory clinical trial to discern the possibility of the actual clinical application of Minds.NAVI.
METHODS
Participants
Participants were recruited from February to September 2022 through outpatient departments at Gangnam Severance Hospital, hospital groups, and online advertisements. Recruited participants were screened through interviews by psychiatrists and clinical psychologists. For the depression group, we enrolled individuals who 1) were aged 19-50 years and consented to participate in the study, 2) had a score ≥11 points on the Depression Rating Scale of the Korean version of the Quick Inventory of Depressive Symptomatology—Self-report (K-QIDS-SR), and 3) a Diagnostic and Statistical Manual of Mental Disorders, Fifth Edition (DSM-5) diagnosis of major depressive disorder. For the healthy control (HC) group, enrollees included individuals 1) aged 19-50 years old, 2) with a K-QIDS-SR score <5 points, and 3) without significant psychiatric diagnosis in each module of the Mini International Neuropsychiatric Interview. Meanwhile, the study exclusion criteria included the following: 1) physical illnesses that may contribute to depressive symptoms (e.g., thyroid abnormalities, uncontrolled diabetes mellitus) or use of therapeutic medications (e.g., hormonal agents, oral steroids, oral contraceptives) that may affect depressive symptoms in the last 3 months, 2) adrenal dysfunction, 3) schizophrenia, bipolar disorder, or other co-existing major psychiatric disorders, 4) suspected intellectual disability (Short Form Intelligence Test score <70 points), 5) intraoral treatment in the last 2 weeks, 6) pregnant or lactating women, 7) severe physical illness, 8) foreigners or other individuals who were unable to read the informed consent form (e.g., due to illiteracy), and 9) other patients who, in the opinion of the investigator, were unable to participate in this study. The depression group was divided into mild, moderate, and severe subgroups based on DSM-5 major depressive episode specifier criteria following the screening clinician interview. Of the 75 subjects who provided written informed consent and were screened, 17 out of the study, and 10 did not participate in the baseline assessment, resulting in a final 48 participants completing the study. Of these, one person was excluded from the analysis due to ineligibility for blood and saliva collection (Figure 1). Written informed consent was obtained from all participants. This study was approved by the Institutional Review Boards of Severance Hospital (No. 3-2021-0085) and Gangnam Severance Hospital (No. 3-2021-0440).
Protocol
After screening, confirmed participants were admitted to the hospital for an overnight stay for assessment. Admission was after 4:00 pm, and a full explanation of the assessment was given shortly after admission. Participants were then assessed by baseline test, including checking vital signs and heart rate variability (HRV). They were then administered the Minds.NAVI PROVE survey. At 9 pm, saliva was collected for Minds.NAVI analysis, and blood was drawn for cortisol and DHEA testing. After sleep, saliva was collected immediately upon waking, 30 min after waking, and 1 hour after waking, and blood was collected with the last saliva collection at 1 hour after waking. Participants were then assessed for adverse events and sent home.
Minds.NAVITM
The evaluation of mental health was performed utilizing Minds., an assessment tool created by Minds AI Co., Ltd. (Seoul, South Korea). Minds.NAVITM (MindsAI.Co.Ltd, Seoul, Republic of Korea) includes a self-report survey (“PROVE test battery”) focusing on psychosocial factors associated with depression, including depressive symptoms, as well as protective and vulnerability factors and functional stage of the adrenal cortex through analyses of salivary hormones.
PROVE test
The PROVE test, a self-report questionnaire, serves as a battery tool to screen and assess depression [26]. It encompasses six subdomains focusing on aspects of depressive symptomatology (PROVE-DS), suicide risk (PROVE-SR), adult attachment type (PROVE-AAT), adverse childhood experiences (PROVE-ACE), mentalization capacity problems (PROVEMC), and resilience (PROVE-Korean resilience quotient [KRQ]). This comprehensive assessment aims to evaluate not only depressive symptoms, but also protective and vulnerable factors that can influence the overall course of the disease and treatment planning. The validity and reliability of the PROVE test have been established through comparative analyses with matched known standardized scales.
PROVE-DS
The PROVE-DS subdomain comprises 15 questions, rated on a 5-point (0-4 points) Likert scale. Participants review their status over the past 2 weeks and indicate the degree of symptoms related to depression. Scores ranging from 0-8, 9-25, 26-37, 38-45, and 46-48 points represent no, minimal, mild, moderate, and severe depression, respectively. The Cronbach’s α value for PROVE-DS was 0.93.
PROVE-SR
The subdomain for suicide ideation and risk includes 6 questions; 5 of these are yes/no questions, and the sixth is a 4-point (1-4 points) Likert scale item. The total possible score ranges from 0-20 points, with scores of 0-4, 5-7, and ≥8 points indicating low, borderline, and high SR, respectively.
PROVE-AAT
The adult attachment subdomain investigates participants’ current intimate and close relationships. It consists of two subscales: attachment anxiety and attachment avoidance. Each subscale contains nine questions rated on a 7-point Likert scale, with some items reversely scored. The total range for each subscale is 9-63 points, where higher scores indicating greater anxiety or avoidance. Based on these subscales, adult AATs are classified into four categories: secure, dismissing, preoccupied, and disorganized. The Cronbach’s α values for attachment anxiety and avoidance scores were 0.93 and 0.77, respectively.
PROVE-ACE
The PROVE-ACE subdomain evaluates ACEs during early life, including abuse, neglect, and bullying. It consists of 52 items rated on a 4-point Likert scale and is divided into six subscales: emotional abuse, physical abuse, sexual abuse, neglect, exposure to domestic violence, and bullying. Higher scores indicate higher frequency of negative experiences. The cutoff scores for each subscale varied by sex, and participants were classified as having or not having ACEs based on whether any item exceeded the cutoff. The Cronbach’s α value for PROVE-ACE was 0.95 overall and ranged from 0.86-0.93 across subscales.
PROVE-MC
The subdomain for mentalization problems includes five sub-factors with a total of 16 items rated on a 5-point Likert scale. These sub-factors assess lack of emotional awareness, lack of emotional expression and interaction, psychic equivalence mode, hasty incomplete mentalizing, and lack of mentalizing others. Higher scores indicate a failure of the mentalizing process and a lack of MC. The Cronbach’s α values for the subfactors of PROVE-MC ranged from 0.47-0.76.
PROVE-KRQ
The KRQ in the PROVE battery measures resilience and is based on the modified and supplemented Resilience Quotient Test (RQT) developed by Reivich and Shatté, tailored to the Korean context [27-29]. The KRQ consists of 53 items rated on a 5-point Likert scale. Higher scores indicate higher resilience, and total scores ≥212, 181-211, and ≤180 points suggest high, average, and low resilience, respectively. The Cronbach’s α value for PROVE-KRQ was 0.92 overall and ranged from 0.83-0.89 across subscales.
Salivary stress hormone result
Saliva samples were collected to examine the HPA axis function indexed by the post-awakening cortisol and DHEA concentrations. DHEA is a steroid under the regulation of adrenocorticotropic hormone (ACTH), recognized for its antiglucocorticoid properties. The opposing effects of DHEA on cortisol within the brain imply that solely measuring cortisol levels may yield an inadequate assessment of hypercortisolemia. A more accurate means of evaluating the extent of ‘functional’ hypercortisolemia involves the calculation of the cortisol-to-DHEA ratio. The area under the curve (AUC) of cortisol (CorAUC) and AUC of DHEA (DHEAAUC) are the total cortisol and DHEA secretions during the post-awakening period and were calculated as the AUC with respect to ground from the time point immediately after awakening to 60 min. CorAUC was derived by summing the values of the immediate, 30, and 60 minutes after waking up, and DHEAauc was calculated by adding up the values of the immediate and 30 minutes after waking up. The ratio of CorAUC to DHEAAUC is a reliable index of HPA axis function.7,30 Participants collected 2 mL of saliva into collection tubes at 9 pm and at 0 min, 30 min, and 60 min after awakening. Saliva hormone analysis results are presented using a 3×3 table in Figure 2. The salivary hormone results of the patients are categorized as indicating normal, acute, transitional, or chronic stress according to the values of CorAUC and DHEAAUC.
Group classification algorithm
The PROVE battery generated comprehensive results categorized as green (healthy), yellow (borderline), or red (risky) mental health states by integrating the outcomes of the first and second evaluation steps (Figure 2). The first evaluation step included PROVE-AAT, PROVE-ACE, PROVE-MC, and PROVE-KRQ results, which can impact the development of depression. Based on these three subdomains, the balance between protective and vulnerable factors for depression was categorized as “good,” “normal,” or “caution” (Figure 2). A “good” balance was assigned when there were no vulnerability factors related to insecure attachment, positive ACE history, or deficient resilience. If one vulnerable factor exists among the three subdomains, the balance is classified as “normal.” When two or more vulnerable factors were present, the balance was considered “cautious.”
In the second evaluation step, participants were divided into depressive or non-depressive subgroups with or without suicidal risk based on the severity of PROVE-DS and SR. Taking into account the results of the first evaluation, the final PROVE battery outcome is presented as a four-stage mental health state. Finally, the PROVE battery results were combined with the salivary stress hormone results to produce the final Minds.NAVI results. Minds.NAVI results were categorized into green (healthy) or yellow (concern) for non-depression and orange (mild) or red (severe) for depressive disorders. The green group was characterized by no symptoms, protective factors, and good salivary results, while the yellow group included individuals in whom no major symptoms were present but hormonal abnormalities were observed or in whom there were mild symptoms rather than disease. If the symptoms were mild but the salivary hormone results showed chronic stress or if the symptoms were moderate, then the individual could be classified into the orange group. The classification algorithm for Minds.NAVI is illustrated in Figure 2.
Other Measurements
K-QIDS-SR
The K-QIDS-SR scale is a 16-item, self-report test that focuses on nine symptom domains in the DSM-IV diagnostic criteria for major depressive disorder. K-QIDS-SR assesses depressive symptoms over the past week. Each symptom domain (depressed mood, concentration, self-blame, suicidal ideation, interest, energy/fatigue sleep disturbance, appetite/weight change, and psychomotor agitation/retardation) can be scored on a 0-3-point scale, with a total possible score ranging from 0-27 points. Higher scores indicate higher frequency of severe depressive symptoms. The Cronbach’s α value for the K-QIDS-SR was 0.73 [31].
Hamilton depression rating scale
The Hamilton depression rating scale (HAM-D) is a widely used tool for evaluating the severity of depressive symptoms. It consists of 17 items that assess various aspects of depression, including mood, work and activities, sleep, suicidal ideation, psychomotor agitation or retardation, appetite, sexual interest, anxiety, somatic symptoms, and cognitive symptoms. Each item on the HAM-D is rated on a scale of 0-2 or 0-4 points, with higher scores indicating greater severity (e.g., item 3, Suicide: 0=absent, 1=feels that life is not worth living, 2=wishes they were dead or any thoughts of possible death to self, 3=suicidal ideas or gestures, 4=attempts at suicide). The Cronbach’s α value for the Korean version of HAM-D was 0.73 [32].
Generalized anxiety disorder-7
The generalized anxiety disorder-7 (GAD-7) is a 7-item scale used to assess anxiety symptoms experienced over the past two weeks. Each item measures the frequency and severity of an anxiety symptom, such as feeling nervous, worrying excessively, and experiencing restlessness or irritability. The items are rated on a scale of 0-3 points, with a maximum total score of 21 points, and a higher score indicates a greater level of anxiety symptoms. The GAD-7 is a reliable tool for quantifying the pathological severity of anxiety symptoms, with a Cronbach’s α value of 0.93 for the Korean version [33].
Perceived stress scale
The perceived stress scale (PSS) is a commonly used tool to measure an individual’s subjective perception of stress. It consists of 10 items that assess how individuals perceive their levels of unpredictability, controllability, and overwhelm over the past month. Each item is rated on a scale of 0-4 points, with higher scores indicating greater levels of perceived stress, and the total score ranges from 0-40 points. The Korean version of PSS is a reliable measure, with a Cronbach’s α value of 0.82 [34].
HRV
In this study, an adhesive patch-type device called the mobiCARE MC-100 (Seers Technology, Seongnam, South Korea), was utilized to measure HRV. The MC-100 device consists of two medical-standard 4.0 mm electrode snaps connected by a single wire, which can be attached using conventional sticky electrocardiography electrodes. It is powered by a CR2032H coin cell battery commonly available in the market, enabling continuous operation for ≥72 hours. The dimensions of the device are 29×120 mm, and it weighs 8.9 g. It is equipped with a single-lead electrocardiography signal recording capability, sampling at a rate of 256 Hz. Furthermore, the device is equipped with accelerometers and gyroscopes to measure movement activity. It establishes a connection with a smartphone through Bluetooth, enabling transmission of electrocardiography data to the smartphone.
Hormone analysis
Collected samples of saliva were stored at -80°C until further analysis. After blood collection, serum was separated by centrifugation at 3400 rpm for 10 min and stored at -80°C. Cortisol and DHEA biochemical parameters were analyzed using commercially available reagent kits. In saliva, cortisol and DHEA were analyzed using a cortisol saliva enzyme-linked immunosorbent assay (ELISA) kit (Mast Bio. Co., Ltd., Seoul, South Korea) and a DHEA saliva ELISA kit (Mast Bio. Co., Ltd.), respectively. In blood, corticosteroid-binding globulin serum ELISA (Naroo Digeth Inc., Seongnam, South Korea) and Roche ALB2 (Roche Diagnostics, Seoul, South Korea) kits were performed for cortisol, while the DHEA concentration was analyzed by DHEA Serum ELISA (Mast Bio. Co., Ltd.). The instruction manuals provided with the kits were strictly followed. All saliva samples were analyzed in a biochemistry laboratory.
Statistical analysis
Non-parametric statistics were used because of the small sample size of the data and the finding that most psychometric variables did not meet normality tests. Normality was satisfied for the salivary hormone cortisol/DHEA AUC ratio, so parametric statistics were used for only this variable. Chi-square tests were used to examine group differences in categorical variables, and Kruskal-Wallis tests were used to examine group differences in continuous variables, such as psychological scale scores and salivary hormones, while Mann-Whitney U tests were used for post hoc analysis of each group. Differences in salivary hormones were analyzed by one-way analysis of variance. Correlation analysis was performed by Spearman’s analysis.
RESULTS
Demographic and clinical characteristics by group
Figure 1 illustrates the process of the data collection in the analysis of the trial results. Table 1 shows the demographic characteristics of the normal and depressed groups. Participant age, years of education, marital status, and occupational status did not differ between groups. Of the participants, 12 were normal (no depression), 6 were mildly depressed, 22 were moderately depressed, and 7 were severely depressed. Sex proportions did differ between the groups (χ2=12.115, p=0.007). There were also significant differences in psychological characteristics, such as HAM-D, PSS, and GAD-7 scores, between the groups (K-QIDS-SR: χ2=33.078, p<0.001; HAM-D: χ2=35.835, p<0.001; GAD-7, χ2=27.701, p<0.001; PSS: χ2=11.462, p=0.009).
Stress hormones by depression stage
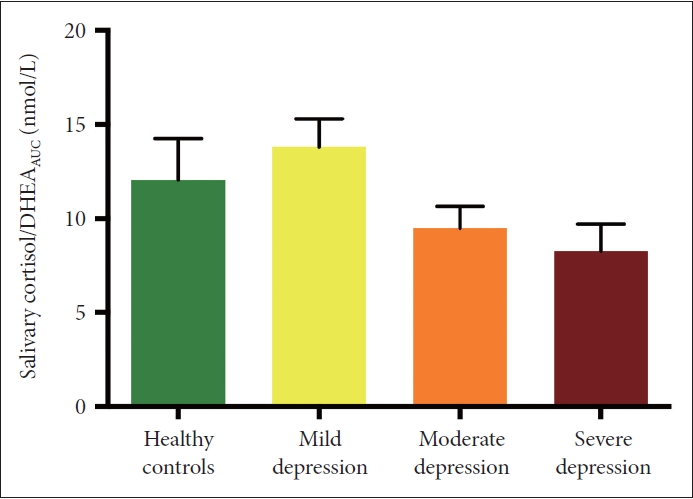
There was a tendency for salivary stress hormone phases to change according to depression stage (χ2=4.706, p=0.030) (Table 3). The proportion of patients in the “adrenal exhaustion stage” was greater in the moderate/severe depression group than in the normal group (HCs vs. moderate/severe depression group: χ2=4.298, p=0.038) (Table 3). The salivary stress hormone indicator Cor/DHEAAUC did not differ between groups (χ2=4.989, p=0.173) (Figure 3).
Protective and vulnerable factors by depression stage
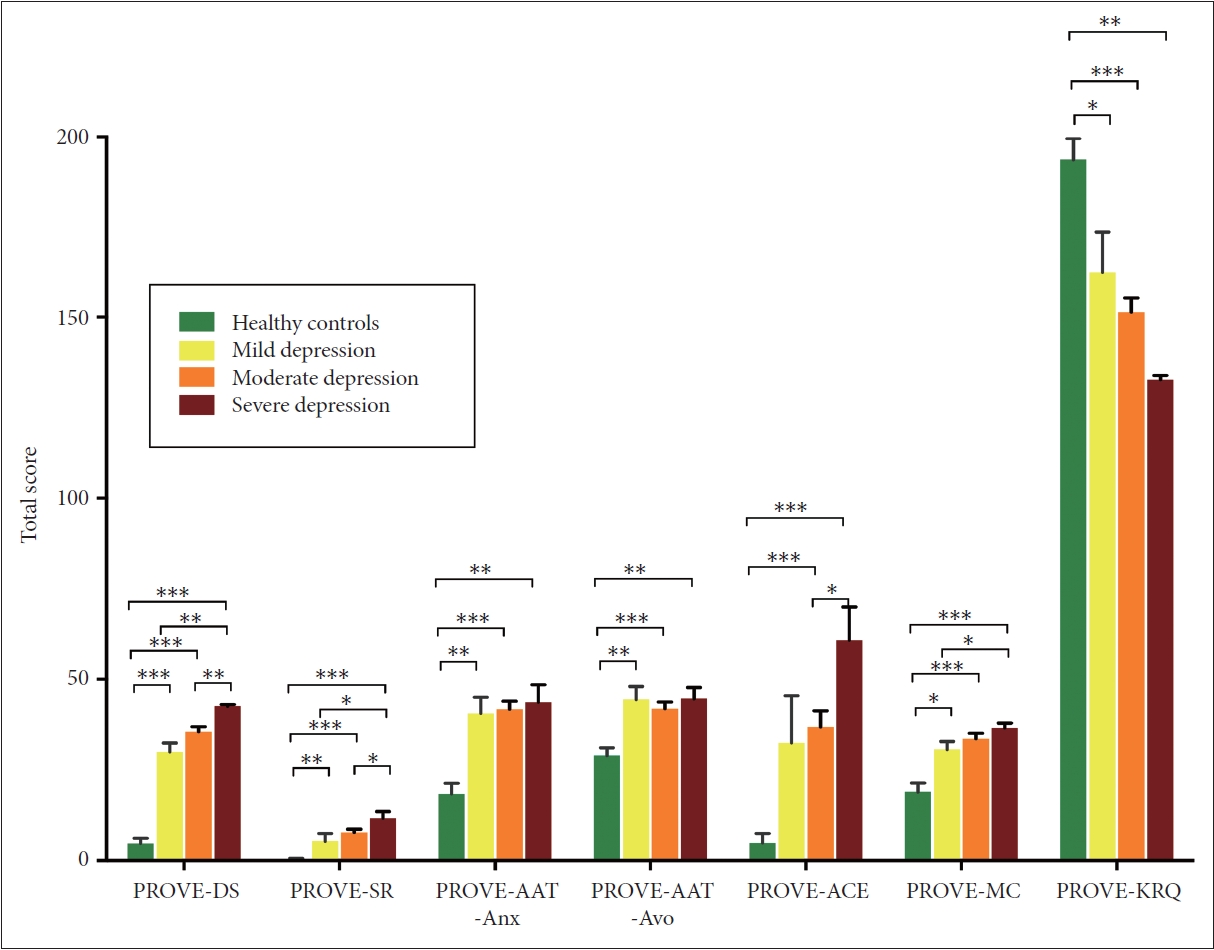
The groups differed significantly in current depressive symptoms (χ2=33.636, p<0.001) and SR (χ2=28.444, p<0.001) as well as in attachment anxiety (χ2=19.954, p<0.001), attachment avoidance (χ2=16.604, p<0.001), ACEs (χ2=22.000, p<0.001), lack of MC (χ2=22.147, p<0.001), and resilience (χ2=21.991, p<0.001) as assessed by PROVE testing (Figure 4). For depression and SR, all groups were significantly different from each other (PROVE-DS, HCs vs. mild depression group: Z=-3.382, p<0.001; HCs vs. moderate depression group: Z=-4.765, p< 0.001; HCs vs. severe depression group: Z=-3.567, p<0.001; mild vs. moderate depression group: Z=-1.909, p=0.056; mild vs. severe depression group: Z=-3.021, p=0.003; moderate vs. severe depression group: Z=-2.865, p=0.004) (PROVE-SR, HCs vs. mild depression group: Z=-2.677, p=0.007; HCs vs. moderate depression group: Z=-3.382, p<0.001; HCs vs. severe depression group: Z=-3.754, p<0.001; mild vs. moderate depression group: Z=-1.212, p=0.225; mild vs. severe depression group: Z=-2.000, p=0.046; moderate vs. severe depression group: Z=-2.127, p=0.033). For attachment avoidance, attachment anxiety, and resilience scores, the normal group was significantly different from each of the depression groups (PROVE-AAT-avo, HCs vs. mild depression group: Z=-2.817, p=0.005; HCs vs. moderate depression group: Z=-3.54, p<0.001; HCs vs. severe depression group: Z=-3.052, p=0.002) (PROVEAAT-anx, HCs vs. mild depression group: Z=-2.906, p=0.004; HCs vs. moderate depression group: Z=-4.04, p<0.001; HCs vs. severe depression group: Z=-3.216, p=0.001) (PROVE-KRQ, HCs vs. mild depression group: Z=-2.343, p=0.019; HCs vs. moderate depression group: Z=-4.04, p<0.001; HCs vs. severe depression group: Z=-3.13, p=0.001). For ACEs, the normal group differed from the moderate depression and severe depression groups, and the moderate and severe groups differed one another (PROVE-ACE, HCs vs. mild depression group: Z=-1.802, p=0.072; HCs vs. moderate depression group: Z=-4.111, p<0.001; HCs vs. severe depression group: Z=-3,642, p<0.001; mild vs. moderate depression group: Z=-0.644, p=0.519; mild vs. severe depression group: Z=-1.717, p<0.086; moderate vs. severe depression group: Z=-2.04, p=0.041). For lack of MC score, the normal group differed from the depression groups, and there was also a difference between the mild and severe depression groups (PROVE-MC, HCs vs. mild depression group: Z=-2.555, p=0.011; HCs vs. moderate depression group, Z=-4.006, p<0.001; HCs vs. severe depression group: Z=-3.553, p<0.001; mild vs. moderate depression groups: Z=-1.319, p= 0.187; mild vs. severe depression group: Z=-2.158, p=0.031; moderate vs. severe depression group: Z=-0.945, p=0.345).
Stress hormone, index, and depressive symptoms
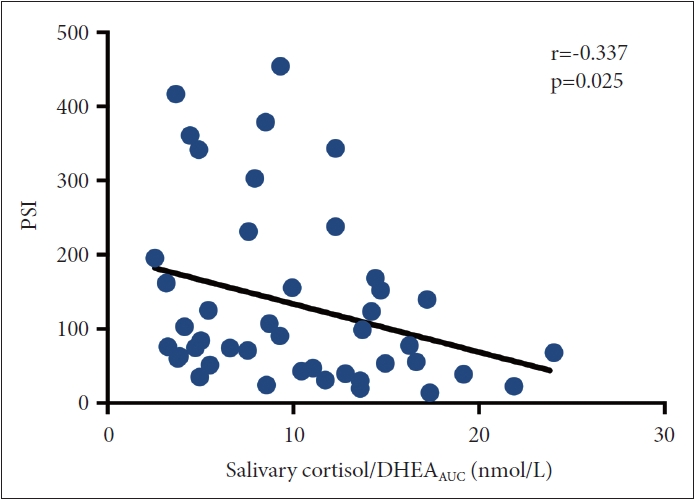
The Cor/DHEAAUC was negatively correlated with scores on the K-QIDS-SR (i.e., the more severe was the depression, the lower was the salivary hormone awakening response [r=-0.31, p=0.034]) (Figure 5). Physidal stress index (PSI), as measured by HRV, was also negatively correlated with Cor/DHEAAUC, indicating that the more stressed was the individual, the lower was the Cor/DHEAAUC (r=-0.337, p=0.025) (Figure 6).
Stress hormone in saliva and blood
The amount of cortisol and DHEA in saliva and blood was significantly correlated (Supplementary Figure 1 in the online-only Data Supplement). Cortisol and DHEA measured in blood and saliva at the same time in both morning and evening were highly correlated (morning cortisol, r=0.693, p<0.001; night cortisol, r=0.847, p<0.001; morning DHEA, r=0.671, p<0.001; night DHEA, r=0.562, p<0.001) This suggests that salivary hormones can be a good reflection of stress hormone status in the blood.
DISCUSSION
This study examined the clinical effectiveness of Minds. NAVI, a depression screening kit that combines psychometric measures and stress hormone biomarkers of depression, in a prospective exploratory clinical trial. The results revealed that Minds.NAVI has positive potential as a screening tool with an acceptable level of accuracy for diagnosis of depression, which is examined in a small population. The psychological assessment tools and salivary hormone staging within Minds.NAVI differed by depression severity, suggesting that it may be useful for severity categorization. In addition, there was an inverse correlation between depressive symptoms and salivary stress hormones and between salivary stress hormones and HRV stress index. This inverse correlation suggests that depression and chronic stress may be associated with hyporesponsiveness of the HPA axis.
The hyporesponsive CAR in the group with higher depression scores is consistent with our previous findings [35]. In that study, we retrospectively analyzed Minds.NAVI data collected through a pilot project, which also showed that higher depression and greater vulnerability on the protective and vulnerability factor scale for depression were associated with lower CAR. Another 2-year follow-up study, as well as studies of hospitalized or elderly patients, also showed that severe depression is associated with lower CAR [19].
However, other studies have reported hyperresponsiveness of CAR in depressed patients. Higher CAR has been observed in middle-aged and adolescent female depressed patients, as well as in patients in remission, compared to normal controls [36,37]. These discrepancies may be due to differences in the severity of the clinical populations by study or the type of depression. In one study, no group differences in CAR were observed when the depression type was not distinguished, but an inverted U shape was observed when the type was distinguished, especially for the anhedonic type, with CAR increasing with depression level [18]. There are also studies that show differences in HPA axis function between atypical and melancholic-type depression [38,39], distinct types of the disorder. Melancholic depression is typically characterized by decreased appetite and sleep, is worse in the morning, and involves anxious symptoms, while atypical depression is characterized by increased appetite, hypersomnia, leaden paralysis, and worse symptoms in the evening [38,40]. The literature suggests that atypical depression has a more chronic, unrelenting course [41]. In a 40-year meta-analysis, Stetler and Miller [13] found a more distinct pattern of relative hypocortisolemia in atypical depression compared to melancholic depression. There are studies that suggest that the mechanism underlying the different cortisol responses in these two types of depression involves hypothalamic corticotropin-releasing hormone (CRH) [38]. Unlike melancholic depression, which has an elevated hypothalamic CRH, atypical depression has been shown to involve a downregulation of the HPA axis or a hypothalamic CRH deficiency. There are also studies showing that individuals with early life trauma and early deprivation are more likely to have a hypoactive HPA axis, and atypical depression appears more common in these patients [42,43]. Taken together, these findings indicate that depression subtypes or severities may influence the direction of change in CAR. Further evaluation by recruiting groups according to depression type and by measuring salivary CAR may be beneficial.
In terms of psychological assessments, numerous studies have confirmed that the major protective and vulnerability factors of attachment insecurities, ACEs, lack of mentalization, and low resilience are prominent characteristics of depressed patients compared to those of HCs [22-25]. The present study confirmed these features in depressed patients. Attachment anxiety, attachment avoidance, and resilience were clearly differentiated between the HC and depressed groups, while ACE and MC were different between individuals with mild or moderate depression and those with severe depression. This suggests that a consistent lack of mentalization may be a vulnerability factor for more severe depression.
A correlation between depressive symptom severity and salivary stress hormone response was also observed in this study; the more severe was the depression, the lower was the CAR. This is consistent with the finding that CAR was lower in severe and chronic depression. In our previous work, inverse correlates of CAR were related not only to depression symptoms, but also to protective-vulnerability factors; notably, lower resilience, higher ACE, greater attachment anxiety or attachment avoidance, and lower mentalization were associated with lower CAR [35].
It has been suggested that ACEs interfere with development of the HPA axis, leading to chronic dysregulation. Iob et al. [44] have followed twins to prospectively examine the mediation of cortisol between trauma and depression in early adulthood. They found that higher levels of trauma were associated with lower cortisol levels, which in turn were associated with depression in early adulthood. As mentioned earlier, cortisol is often hyperactive in depression, but it is often low in trauma patients [45]. Therefore, these findings suggest that depressed patients with trauma experience a more severe course of depression at a younger age, and a blunted HPA axis may be one of the factors contributing to this.
In this study, values of cortisol and DHEA in saliva were highly correlated with serum values. These results have been confirmed by previous studies [46,47]. Salivary cortisol consistently correlated with serum cortisol when measured over a 24-hour period [46]. It has also been suggested that salivary hormone is more appropriate for studies looking at the function of the HPA axis, as it does not have to account for interindividual variation in cortisol binding globulin when looking at the response of cortisol [47]. Therefore, it is reasonable to use saliva as a material to measure the stress response of the HPA axis.
Limitations of this study include the small number of subjects due to its exploratory nature, which makes it difficult to conclude statistical significance, and the sex ratio of the population was different between groups. Future studies should include a larger number of subjects and a more balanced population to ensure significance. In fact, the current sensitivity and specificity can be interpreted as very limited due to the small sample size and unbalanced gender ratio, so additional larger trials are definitely needed. A second limitation is the lack of assessment of depression subtypes. Biologically, the response to cortisol may vary depending on the subtype of depression, and this should be further evaluated in future trials. Finally, we cannot exclude the possibility that evaluation by hospitalization may have been stressful for participants due to the unfamiliar environment. This is especially true given that insomnia is a common comorbidity in patients with depression. Although it was essential to determine the correlation with blood collection and it was good to be able to time the saliva collection accurately, a follow-up study in which saliva is collected at home in its natural state is needed.
In conclusion, this study demonstrated the potential of Minds.NAVI as a screening tool for depression, combining psychometric measures and stress hormone biomarkers. The findings revealed differences in psychological assessment tools and salivary hormone staging across depression severity groups, suggesting its usefulness for severity categorization. The study also highlighted an inverse correlation between depression symptoms and salivary hormones, indicating a possible association between depression, chronic stress, and hyporesponsiveness of the HPA axis. However, further research is needed to address limitations, such as small sample size, imbalanced sex ratio, and absence of depression subtype assessment, to obtain a comprehensive understanding of these relationships.