


INTRODUCTION
Importance of psychiatric disease and diagnostic limitations
Psychiatric disorders are mental health conditions constituting abnormal alterations in thinking, emotion, and behavior leading to distress and interference with normal social functioning [1]. World Health Organization recognizes mental illnesses as one of the most prevalent health conditions with catastrophic mortality, morbidity, and disability rates. A severe type of psychiatric illness may decrease 13 to 32 years of average life expectancy [2,3]. Approximately one in five U.S. adults lives daily with these ailments [4]. These conditions account for 30%-40% of chronic sick leave and nearly 4% of western countries’ gross domestic product cost [5].
Modern individualistic society increasingly suffers from these disorders, accounting for nearly 655 million estimated cases in 1990 and 970 million cases in 2019, demonstrating an increase of 48.1%. They were the 13th leading cause of disability-adjusted life years in 1990. However, they rose to the 7th rank in 2019 [6]. Despite the increasing burden and associated clinical and social implications around them, little has improved our clinical diagnostic abilities. Psychiatrists rely on patients’ descriptions of symptoms, mental status examinations, and clinical behavioral observations in their diagnostic, management, and follow-up approaches [7]. Moreover, unlike other medical conditions, psychiatric disorders are classified by diagnostic categories with a broad list of symptoms. Therefore, patients diagnosed with the same class type may have substantial heterogeneity in their clinical manifestation. Lastly, the lack of neurochemical and neuroimaging knowledge put additional hurdles in our diagnostic and therapeutic approaches. Through the past couple of years, researchers have put a tremendous effort into finding new biomarkers to support diagnosis, prevention, further substratification of major categories, and new methods to assess follow-up treatment response in psychiatric patients [8].
Experts categorize these advances in precision and personalized medicine into five major “omics” fields: genomics, transcriptomics, proteomics, metabolomics, and epigenomics [9-12]. This article reviews the evolving field of radiomics and its role in diagnosing psychiatric disorders as the sixth potential “omics.” In this respect, the PubMed dataset was searched for [Ramiomic, OR Radiomics, OR texture analysis, OR Omics], and different psychiatric disorders based on the Diagnostic and Statistical Manual of Mental Disorders and the current applications of radiomics in psychiatry is being reviewed here. Neurology disorders and neurodegenerative diseases are beyond the scope of this review.
INTRODUCTION TO RADIOMICS
Radiomics is a rapidly evolving medical research field, most implemented and tested in oncology using radiology and pathology images. Radiomics aims to capture the hidden features within medical images that are beyond the ability of human eyes. Radiomics has been implemented to predict histopathology characteristics, genomics, proteomics, disease progression, treatment response, survival, and many more clinical parameters which are not evident in the standard evaluation of medical images by a human expert [13]. Radiomics analysis can be performed on many types of radiologic imaging, including computed tomography (CT) scan, magnetic resonance imaging (MRI), positron emission tomography (PET), and single-photon emission computed tomography (SPECT) imaging.
The radiomics analysis begins with segmenting the regions of interest (ROI) or lesions which can be done on 2D or 3D images. Traditionally the ROIs are being segmented by radiologists, and the segmentation task is the most time and cost-consuming part of the process. Achievements in artificial intelligence (AI) now enable us to take advantage of automated and semi-automated AI-based segmentation. Subsequently, specific software will extract hundreds or thousands of features from the ROI in a few seconds. These features are essentially complex mathematical representations of pixels and voxels with ROI or lesion. The most commonly used features are shape-based, histogram-based, and texture-based features (Figure 1) [14].
Shape features
The shape features are the simplest form of the radiomics features, describing the two- or three-dimensional size and shape of the ROI and include volume, surface area, sphericity, etc [14].
Histogram features
These features belong to the first-order radiomics features given that they are based on analysis of the single voxel or pixel. The mean, maximum, minimum, variance, and percentiles of densities (CT scan), intensities (MRI), and standardized uptake value (PET) are examples of histogram features.
Texture features
Texture features are the essential form of radiomics features. These features essentially are a computational representation of the heterogeneity of the signal intensity (MRI), density (CT), or standardized uptake value (PET) of pixels/voxels within the ROI [14].
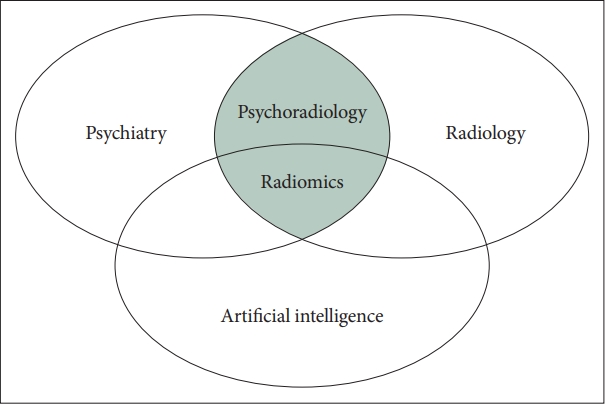
The “psychoradiology” consists of using radiologic approaches in patients with major psychiatric disorders for diagnosis, treatment planning, and monitoring (Figure 2) [15]. The concept of psychoradiology fits very well in radiomics, given that many psychoradiologic techniques constitute volumetric analysis, one of the principal radiomics features (shape features).
CURRENT RADIOMICS APPLICATIONS IN PSYCHIATRY
Major depressive disorder
It is well-known that major depressive disorder (MDD) is caused by abnormal function of several cerebral neurotransmitters, mainly norepinephrine, and serotonin [16]. However, the physiopathology of MDD is not limited to the neurons, and cerebral structural changes can be detected on gross anatomy/medical imaging. Traditional structural brain imaging in MDD describes abnormalities in multiple brain regions, especially in prefrontal-limbic circuits. In MDD, decreased gray matter in the prefrontal lobe, limbic system, striatum, cerebellum, temporal lobe, and bilateral lingual gyri have been reported [17]. White matter changes in MDD have also been described, with diffusion tensor imaging (DTI) studies showing lower fractional anisotropy values in the white matter of the right middle frontal gyrus, left lateral occipitotemporal gyrus, and angular gyrus of the right parietal lobe when compared to healthy subjects [18].
Ma et al. [19] implemented radiomics analysis on T1 and DTI MRI sequences to differentiate the healthy control (HC) adolescents from adolescents with MDD and subthreshold depression (StD). They found ten features to be most predictive in differentiating MDD from HC, eight features in differentiating StD from HC, and seven features in differentiating MDD from StD using random forest (RF) machine learning. They achieved accuracies and area under the curve (AUC) of 86.75%, 0.93 for differentiation of MDD from HC (most predictive anatomic locations: left medial orbitofrontal cortex, right superior, middle temporal regions, right anterior cingulate, left cuneus, and hippocampus), and 70.51%, 0.69 for differentiation of StD from HC (most predictive anatomic locations: left cuneus, medial orbitofrontal cortex, cerebellar vermis, hippocampus, anterior cingulate and amygdala, right superior and middle temporal regions), and 59.15%, 0.66 for differentiation of MDD from StD (most predictive anatomic locations: left medial orbitofrontal cortex, middle temporal and cuneus, right superior frontal, superior temporal regions and hippocampus, and anterior cingulate).
Furthermore, Zhang et al. [20] used radiomics analysis to differentiate isolated Parkinson’s disease from Parkinson’s disease with depression versus healthy volunteers. They extracted 6,557 features from frontotemporal lobes on resting-state functional MRI (fMRI; resting-state functional connectivity [RSFC], amplitude of low-frequency fluctuation [ALFF], regional homogeneity [ReHo], and voxel-mirrored homotopic connectivity [VMHC]). Subsequent least absolute shrinkage and selection operator (LASSO), RF, and support vector machine (SVM) analysis selected the most predictive features. All three classifier models (LASSO, RF, and SVM) have accuracy above 90% in differentiating the isolated Parkinson’s disease versus Parkinson’s disease with depression versus healthy volunteers.
Radiomic analysis can predict treatment response to repetitive transcranial magnetic stimulation (rTMS) in neurocognitive disorders. In one study by Lu et al. [21], the patients with higher cortical thickness in the left dorsolateral prefrontal cortex had a higher chance of remission after rTMS. Since volumetry is one of the radiomics features, it is possible that radiomics can predict rTMS treatment response in MDD as well.
Schizophrenia
Schizophrenia (SZ) is a complex neuropsychiatric syndrome with a heterogeneous genetic, neurobiological, and phenotypic profile. Some abnormalities can be detected by anatomic MRI imaging including: 1) decrease in gray matter volume, 2) superior temporal gyrus volume loss (more common in an auditory hallucination), and 3) prefrontal lobe volume loss (more common in negative symptoms); MR spectroscopy (low N-acetyl aspartate in hippocampal gray and white matter and prefrontal cortices), and fMRI (abnormal activation in “default mode network” which includes bilateral precuneus and inferior-lateral temporal cortices, posterior cingulate and inferior parietal gyri [right sided] and right medial prefrontal cortex) [22].
It has been shown that the radiomics analysis on T1 MRI (posterior cingulate cortex) and PET images (frontal cortex) could differentiate SZ patients from normal volunteers with an AUC of 0.89 and 0.82, respectively [23].
Furthermore, radiomics analysis has been used for response prediction in electroconvulsive therapy in patients with SZ. Fifteen first-order radiomics features from 19 regions of the white matter on the T1 MRI images based on a logistic regression model achieved an accuracy of 90.91% in the training dataset and 87.59% in the test dataset in the differentiation of the responders from non-responders. The accuracy of the SVM was reported as 90.91% for the training dataset and 91.78% for the test dataset [24].
The utility of radiomics features from the bilateral hippocampi on the T1 sequence has also been studied to differentiate patients with SZ versus volunteer cases. Among different combinations of feature selection and machine learning models, the “mutual information feature selection” associated with logistic regression had the best overall performance with an AUC of 0.82, an accuracy of 82%, a sensitivity of 76%, and a specificity of 70% for differentiating schizophrenic patients from the volunteers [25].
In another study, by combining structural and fMRI with radiomics, Cui et al. [26] achieved an overall accuracy of 85.03% (92.04% responders and 80.23% non-responders) in treatment prediction in patients with SZ. This study’s structural features were extracted from the right precuneus, cuneus, and inferior parietal lobule, and the functional features predominately included interhemispheric connectivity. The curvature of the right inferior parietal lobule and functional connectivity between the right inferior frontal gyrus and the left putamen mainly contributed to the prediction performance.
Latha and Kavitha [27] utilized the radiomics features from ventricles and cerebellum on the T1 sequence to differentiate schizoaffective patients from SZ cases. A combination of radiomics features extracted from the cerebellum region reached high classification accuracy of 90.09% for this task.
Bipolar disorders
Patients with bipolar disorders (BD) differ from healthy volunteers on anatomic MRI, including: 1) decreased gray matter volume, decreased white matter volume, and decreased cortical thickness in prefrontal, anterior temporal, and insula cortices; 2) decreased volume of amygdala and hippocampus, and altered striatal volumes; and 3) abnormal fMRI (abnormally elevated activity in the ventral striatum and left prefrontal cortex, in particular, left orbitofrontal cortex, and left ventrolateral prefrontal cortex, during the reward processing) [28,29].
Using fMRI, Wang et al. [30] extracted 7,018 features from the preprocessing resting-state fMRI (mean regional homogeneity [mReHo], mean amplitude of low-frequency fluctuation [mALFF], RSFC, and VMHC). Their dataset constituted 90 patients with unmedicated BD II and 117 HCs. The subsequent LASSO model selected 65 most predictive features, and the final SVM model achieved accuracy and AUC of 87.3% and 0.919 in the training dataset and 80.5% and 0.838 in the validation dataset, respectively, in the differentiation of BD from normal volunteers.
Attention deficit hyperactivity disorder
Patients with attention deficit hyperactivity disorder (ADHD) can be different from controls on anatomic MRI (total brain volume, caudate nucleus, putamen, nucleus accumbens, amygdala, and hippocampus are found to be smaller in ADHD compared to normal subjects) [31].
Sun et al. [32] used radiomics for diagnosing and subtyping ADHD on T1 sequence and DTI. The features related to cortical shape in the left temporal lobe, bilateral cuneus, and regions around the left central sulcus contributed significantly to discrimination of patients with ADHD from control subjects. In contrast, features involved in the default mode network and insular cortex primarily contributed to ADHD subtype discrimination (the RF classifier achieved an average accuracy of 73.7% for identifying individuals with ADHD and 80.1% for discriminating between ADHD-inattentive and ADHD-combined).
Anxiety disorders
Social anxiety is a highly disabling disorder defined as a “marked and persistent fear of social or performance situations.” [33] Kim et al. [34] conducted a study to predict the level of social anxiety in young adults by resting-state brain functional radiomics features. These features included ReHo, the fractional ALFF, fractional resting-state physiological fluctuation amplitude, and degree centrality. From extracted features, the fractional resting-state physiological fluctuation amplitude of the left orbitofrontal cortex, the degree centrality of the left orbitofrontal cortex, and the degree centrality of the left amygdala were the most predictive. Among the different models, the eXtreme Gradient Boosting (XGBoost) model achieved the best performance with a balanced accuracy of 77.7%.
Panic disorder
Panic disorder is a debilitating disorder that seriously impacts adolescents’ social and academic functioning and general well-being [35]. Agoraphobia is characterized by fear or anxiety about multiple situations in which escape might be difficult, or panic-like symptoms may develop [36]. Recent literature suggests that agoraphobia is frequently accompanied by panic disorder [37]. Early and accurate diagnosis of panic disorder with or without agoraphobia (PDA) is crucial in reducing the disease burden. Therefore, Bang et al. [38] investigated the usability of 29 different radiomics features extracted from major fearcircuit structures (amygdala, insula, and anterior cingulate cortex) on T1-weighted MRI images in differentiating patients with PDA from HCs. The AUC and accuracy of the best-performing radiomics model in the test set were 0.84 and 81.3%, respectively.
Internet gaming disorder
In another study, Han et al. [39] investigated T1 and DTI radiomics features in the context of a diagnosis of Internet gaming disorder (IGD) by establishing a radiomics-based machine-learning model. In this study, the features associated with the cortical shape of bilateral fusiform, left rostral middle frontal, left cuneus, left pars opercularis, and regions around the right uncinate fasciculus, and left internal capsule regions were the most predictive features. The final models could differentiate IGD from the control group with an accuracy of 73%.
Autism spectrum disorder
Traditional MRI in patients with autism spectrum disorder (ASD) demonstrates increased total cerebral and amygdala volume, and an increase in cerebral gray and white matter, specifically in the frontal, temporal, and cingulate cortices [40,41].
In one radiomics study on 36 patients with autism and 30 healthy subjects, texture features were extracted from the hippocampus and amygdala on the T1 sequence. Feature selection analysis demonstrated that preliminary results show that 11 features from the hippocampus and four features from the amygdala were different in ASD and normal controls. The subsequent SVM could differentiate these groups with moderate performance (AUC of 0.76) [42].
In another study by Chaddad et al. [43], multiple features were extracted from different brain regions, which revealed asymmetry in the right hippocampus, left choroid-plexus, and corpus callosum, and symmetry in the cerebellar white matter between patients with ASD and normal controls, indicating that radiomics can be used for diagnosis of ASD.
DISCUSSION
Radiomics was first developed in oncologic imaging as a bridge for personalized medicine using imaging biomarkers. However, it can be implemented for any pathology and can analyze any digital images (CT, MRI, SPECT, and PET). It is well known that psychiatric disorders can be associated with structural alterations in the brain, which may not be visible by bare eyes. These structural alterations can be captured by radiomics analysis and be used for clinical prediction. Our review shows that psychiatric radiomics is in evolution. It can be used on the most common psychiatric disorders for diagnosis, prognosis, and treatment response prediction. It can also classify psychiatric patients into more homogenous subtypes, eventually facilitating more effective clinical trials. There are more abundant data about radiomics in SZ and major depression.
Based on our review (Table 1), we know that:
1) The T1-weighted MRI and fMRI are the most common imaging modalities in psychiatric radiomics. However, no data is available regarding other MRI sequences (T2, FLAIR, post-contrast T1, ect.) in this field. Adding other MRI sequences and imaging modalities can potentially improve the performance of this technique.
2) There is heterogenicity in the radiomics pipelines. There is no agreement about the number of extracted features, the number of selected features, and the feature extraction and selection techniques. As a result, other researchers can not easily repeat these studies. A uniform approach is needed to address this limitation.
3) So far, most of the published studies are about small datasets. Also, patients in these datasets are heterogenous in treatment and severity. Therefore, larger, more homogenous, and prospective datasets are needed for more reliable results.
4) Our knowledge in psychoradiology is mainly about the association between the volume changes in different brain regions and psychiatric disorders. Very little is known about the texture alteration in the brain regions without volume alteration. Radiomics analysis from normal-volume brain regions can open a new window to radiopsychiatry.
5) The number of the selected features is often too high, which may cause an overestimation of model performance. In radiomics, the acceptable number of the selected features should be about 10% of the number of samples within the dataset.
6) So far, different machine learning models have been used; however, the RF and SVM are among the most common models.
7) Given the small sample size, most studies evaluated the model performance by cross-validation, which can overestimate the performance. Having a test dataset and especially using an external dataset, can improve the reliability of the studies.
8) In most of the studies, the data, datasets, and trained models were not publicly shared, so the other researchers could not regenerate the studies. Sharing the data and the trained models is critical in radiomics studies.
9) So far, many of the psychiatric disorders have not been studied by radiomics. These include: conduct disorders, disruptive mood dysregulation disorder, feeding and eating disorders, gender dysphoria, intellectual disability, obsessive-compulsive and related disorders, paraphilic disorders, personality disorders, posttraumatic stress disorder, sleep-wake disorders, specific learning disorders, social (pragmatic) communication disorder, somatic symptom and related disorders, and substance-related and addictive disorders.
CONCLUSION
Radiomics fits well within the concept of psychoradiology. Besides volumetric analysis, which is currently the most common psychoradiology approach, radiomics, takes advantage of many other features (e.g., histogram and texture). In the era of precision and personalized medicine, radiomics may open new fields in psychiatry for diagnosing and classifying psychiatric disorders as well as treatment response prediction. However, despite the extensive burden of psychiatric disorders, there are very few published studies in this field, and with small subjects size. In this respect, the initial studies about neuropsychiatric radiomics are promising, with possibilities of radiomics analysis implementation in diagnosis, classification, treatment response, and prognosis prediction in psychiatry. However, several challenges should be addressed before clinical adaptation. So far, the published data in this field have been based on retrospective, single institutional studies on small patient sizes. Prospective multi-institutional studies are needed to evaluate these techniques. Furthermore, the included patients in these studies were selected based on the clinical psychiatric criteria as the gold standard [47]. Given the heterogeneity of psychiatric disorders in terms of presentation, this approach may not be optimal. Besides MRI, there is a lack of data about other imaging modalities which can be potentially used for psychiatric disorders (CT, SPECT, and PET). The heterogeneity of study design is another challenge in radiomics studies. Studies have been conducted using different MRI scanners/protocols/reconstructions, variable software for feature extraction, varying numbers of extracted and selected features, and different machine learning models. Radiomics can not be used for daily clinical practice without a uniform pipeline.