


INTRODUCTION
A 2019 study noted that the global burden of dementia is increasing [1].Several factors such as sex, education level, vascular risk factors, alcohol consumption, and smoking have been identified as risk factors for dementia [2]. Sensory impairment is another recently identified risk factor for dementia. Previous studies have shown that the onset of dementia and cognitive decline are associated with the presence of auditory impairment [3,4]. Studies have also consistently reported that the risk of dementia and cognitive decline increases with visual impairment [5,6]. Some have shown that the risk of dementia and cognitive decline increases with the presence of both visual and auditory impairment [7-9]. Furthermore, a longitudinal study of a community cohort targeting a large-scale Korean older population has corroborated these findings [10].
A recent study that used big data from national-level insurance claims found that auditory or visual impairments increase the risk of dementia in Korea [11,12]. Studies that use claim data, specifically retrospective cohort studies, are limited in identifying direct causal relationships and mechanisms. However, it allows for the inclusion of a large number of participants and for longitudinal follow-up [13]. Moreover, using insurance data from a large participant pool offers strength in terms of generalizability to real-world populations.
However, no insurance claim data study has examined whether the risk of dementia increases in the presence of both auditory and visual impairments. In Asia, particularly in Korea, the rising trend of aging has led to a surge in the number of older adults with auditory or visual impairments, as well as those with dual sensory impairment [14-16]. Therefore, comparing the risk of dementia in those with normal sensory function, visual impairment, auditory impairment, and dual sensory impairment would provide a significant evidence base for establishing relevant health policies. Thus, in this study, we aimed to determine the association of visual and auditory impairments, separately and collectively, with the incidence of dementia using data from the National Health Insurance Service of Korea.
METHODS
Study population
The National Health Insurance Service system of Korea collects data from two main sources: National Health Insurance, which covers 97% of the population, and Medical Aid, which covers the remaining 3% of the population with low income [17]. This database includes demographic information, diagnosis established by International Classification of Disease (ICD) codes, and information of prescriptions. It also includes annual national health checkup data, which comprise laboratory tests and questionnaires about medical history and lifestyle [18]. Among these data, we used disease code and prescription data collected between January 1, 2009 and December 31, 2019. Additionally, data collected from the national health checkup between January 1, 2011 and December 31, 2011 were used.
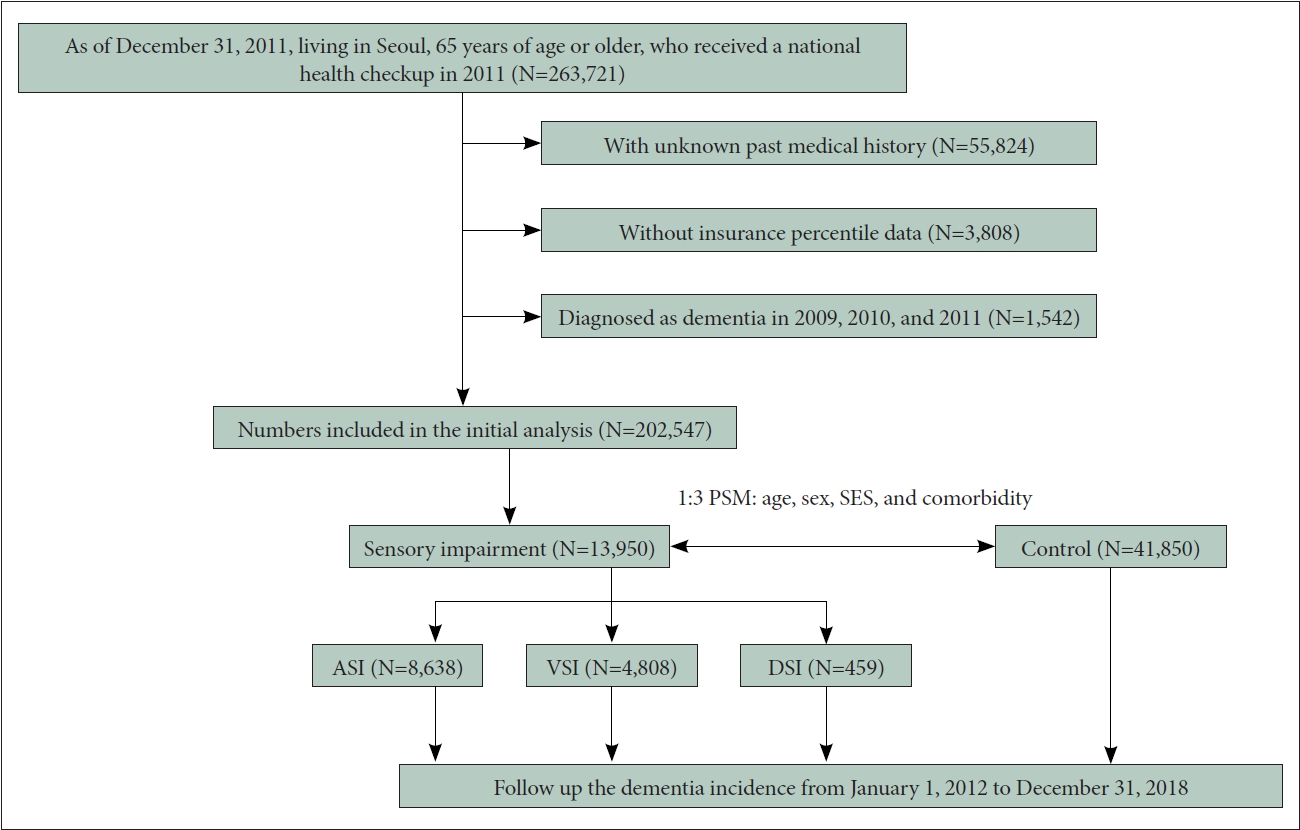
We included 263,721 participants, who were aged 65 or above years as of the index date (December 31, 2011), who resided in Seoul (the capital of Korea), and who received the national health checkup from January 1, 2011 to December 31, 2011. Among them, those with unknown medical history (n=55,824) and those with unknown insurance percentile information indicating socioeconomic status (SES, n=3,808) were excluded. Furthermore, we excluded those diagnosed with dementia between January 1, 2009 and December 31, 2011 using a dementia diagnosis code (n=1,542). Subsequently, we included 202,547 individuals for the initial analysis. Among them, the sensory impairment group and the normal sensory (NS, control) group were matched as 1 to 3 using age, sex, insurance information (indicator of SES), and the comorbidity score was derived through propensity score matching. Consequently, 13,950 individuals with sensory impairment were selected, and 41,850 with normal sensory capacity were classified as the control group. Among the sensory impairment groups, the number of individuals with auditory sensory impairment (ASI), visual sensory impairment (VSI), and dual sensory impairment (DSI, both auditory and visual impairment) were 8,638, 4,808, and 459 members, respectively (Figure 1 and Table 1). The data were sourced from the Korea National Health Insurance Service database. The Deliberative Committee of the Health Insurance Review and Assessment service approved the conditional use of the database. This study adhered to the tenets of the Declaration of Helsinki, and the protocol was reviewed and approved by the Institutional Review Board of Kangwon National University of Korea (IRB number: KNUH-2021-02-021). The need for informed consent for study was waived as part of the study approval.
Definition of incident dementia
We define incident dementia as both the presence of diagnostic codes for dementia (ICD-10 codes F00-F03, G30, and G31) and the prescription of anti-dementia medication at the same time. Based on a previous study [19], the anti-dementia medications considered in our analysis include acetylcholinesterase inhibitors (rivastigmine, galantamine, or donepezil) and N-methyl-D-aspartate antagonist (memantine).
Definition of sensory impairment
ASI was defined as having an “abnormal” diagnosis in both ears in the 2011 national health checkup. Participants wore a headset at a frequency of 1,000 Hz in the hearing test. A tester checked whether the participants could recognize sound stimuli without a hearing aid. If participants could not hear sounds above 40 dB, an “abnormal” diagnosis was made.
VSI was defined as having visual acuity of less than 0.3 in both eyes during the 2011 national health examination. Participants were required to wear corrective glasses or contact lenses if necessary, and their visual acuity was measured using Snellen chart, a standardized test [20]. DSI was defined as the presence of both auditory and visual impairments, while those without visual and auditory impairments were considered as the NS group.
Demographic and clinical variables
Age, sex, and insurance information on the index date (December 31, 2011) were derived from the qualification data of the National Health Insurance Service. As for insurance information, medical aid was the lowest group, and the national health insurance group was divided into 10 percentile units. Comorbid diseases (stroke, heart disease, high blood pressure, diabetes, hyperlipidemia, and other past histories including cancer), body mass index (BMI), current drinking and smoking status, and presence of moderate physical activity for one week were derived from 2011 National Health checkup data. Among these, comorbid disease was coded as 0 or 1, and a sum of six disease scores ranging from 0 to 6 was calculated as a comorbidity score; BMI was divided into <18.5 kg/m2 (underweight), 18.5-22.9 kg/m2 (normal weight), 23.0-27.5 kg/m2 (normal-overweight), >27.5 kg/m2 (obese) according to the Asian elderly criteria (Table 1) [21].
Statistical analyses
First, descriptive statistics of demographic and clinical variables based on index date were calculated in each NS and sensory impairment group (ASI, VSI, and DSI). Between the NS group and the sensory impairment group, the independent t-test was conducted for continuous variables and the chi-squared test was conducted for categorical variables. Furthermore, one-way analysis of variance was conducted for continuous variables and chi-squared test was conducted for categorical variables to compare the four groups: NS group, ASI, VSI, and DSI.
Thereafter, the main outcome of this study, the incidence of dementia, was assessed. The number of incident dementia from January 1, 2012 to December 31, 2018 was calculated every year for four groups, and the total sum was also calculated. After that, multiple Cox regression analyses, with the incidence of dementia as dependent variable, were performed for each sensory impairment group using the NS group as reference. Hazard ratios (HRs) with 95% confidence interval (95% CI) were calculated. Through this, we sought to confirm whether the difference in incidence through seven years in each group was significant. Simultaneously, the same analysis result was visualized as a Cox plot in each group. In the multiple Cox regression analysis, age, sex, SES (insurance percentile), and comorbidity scores were adjusted for Model 1, and in Model 2, drinking, smoking, and presence of moderate physical activity were additionally adjusted.
Thereafter, a sensitivity analysis was performed to exclude the possible case of simultaneous sensory decline in the group with existing dementia. Multiple Cox regression analysis was performed with dementia incidence from January 1, 2014 to December 31, 2018, excluding the group diagnosed with dementia in the first two years from January 1, 2012 to December 31, 2013.
Finally, we examined whether the combination of visual and auditory impairments had a more synergistic effect on dementia incidence than when there was only one. For this, attributable proportion (AP) due to interaction was obtained in the main analysis and sensitivity analysis. The AP interaction formula is as follows [22].
When AP is greater than 0, it means that the two variables have a synergistic effect.
RESULTS
The demographic descriptive analysis showed that compared to the NS group, the sensory impairment group showed no significant difference in age, SES (insurance percentile), heart disease diagnosis, alcohol consumption, and other diseases including cancer on the index date. The sensory impairment group had a higher ratio of stroke, hypertension, diabetes, and smoking tendency than the NS group. They also had a lower ratio of hyperlipidemia, moderate physical activity, and a significantly lower BMI (Table 1).
During the period from January 1, 2012 to December 31, 2018, 5,940 cases of dementia were reported in the NS group, 1,382 in ASI, 853 in VSI, and 114 patients in DSI. A total of 8,289 dementia cases occurred, of which, 6,417 cases occurred in the period excluding 2012 and 2013 (Table 2).
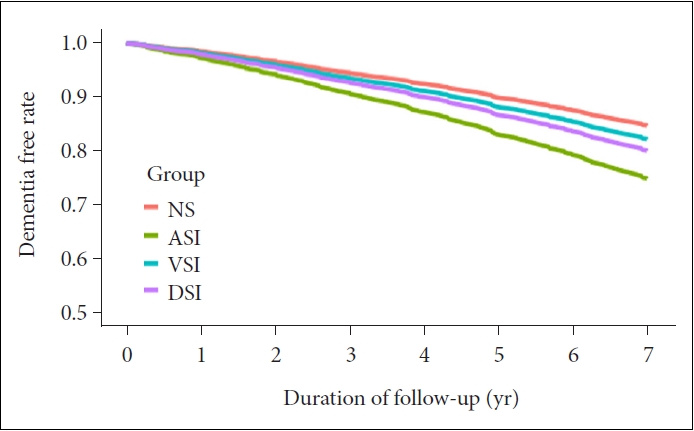
Thus, VSI (HR=1.3731, 95% CI: 1.2775-1.4758), ASI (HR=1.1945, 95% CI: 1.1269-1.2663), and DSI (HR=1.5438, 95% CI: 1.2816-1.8596) showed a significantly higher incidence of dementia than NS adjusting for sex, SES, age, and comorbidity (Model 1). Moreover, with additional adjustment for smoking, alcohol, and activity (Model 2), VSI (HR=1.3553, 95% CI: 1.2608-1.4568), ASI (HR=1.1908, 95% CI: 1.1232- 1.2624), and DSI (HR=1.5267, 95% CI: 1.2674-1.8390) showed a significantly higher incidence of dementia than NS (Table 3). In the Cox plot that visualized this result, the incidence of dementia was significantly higher than that of NS in the order of DSI, VSI, and ASI (Figure 2).
In the sensitivity analysis excluding the incidence case of dementia in 2012 and 2013, VSI (HR=1.3320, 95% CI: 1.2254- 1.4477), ASI (HR=1.1661, 95% CI: 1.0909-1.2466), and DSI (HR=1.5610, 95% CI: 1.2538-1.9434) showed a significantly higher incidence of dementia than NS in Model 1. In Model 2, VSI (HR=1.3178, 95% CI: 1.2123-1.4325), ASI (HR=1.1607, 95% CI: 1.0856-1.2409), and DSI (HR=1.5451, 95% CI: 1.2411-1.9236) also showed a significantly higher incidence of dementia than that of NS (Table 4).
When AP was calculated using HRs of the main analysis, it was -0.0127, indicating that there was no synergistic effect of ASI and VSI on the incidence of dementia. However, the AP obtained using the HRs of the sensitivity analysis was 0.0431, which was greater than 0, suggesting the possibility of a synergistic effect.
DISCUSSION
In this study, the incidence of dementia was significantly higher in cases with visual or auditory impairments than in the NS group. The incidence of dementia particularly increased when both visual and auditory impairments coincided in cases with only one impairment. These results were also significant in the sensitivity analysis that excluded groups with existing dementia, and probably preceded with sensory impairments. Particularly, in the sensitivity analysis, the AP interaction value was greater than 0, suggesting a synergistic effect of visual and auditory impairments on the incidence of dementia.
This study’s result is consistent with that of previous studies which suggested that ASI [3,4], VSI5,6 as well as DSI [7-9] increased the risk of dementia, and findings about the possibility that the decrease in both sensory functions might have a synergistic effect [10]. However, this is the first study in Asia to show that the incidence of dementia was significantly higher in DSI than in ASI or VSI, using nationwide data.
Four major mechanisms by which sensory loss causes cognitive impairment were suggested by an insightful review article. It said, first, “There is a mechanism shared by sensory and cognitive decline, i.e., there is a common cause.” [23] Sensory system shares age-related changing processes with other organs. A typical example is how cardiovascular risk factor affects both hearing loss24 and cognitive decline [25]. However, in this study, despite adjusting the comorbidity score including stroke, heart disease, hypertension, diabetes, and hyperlipidemia in the analysis, sensory loss independently increased the risk of dementia.
The second implies that “Poor cognition affects performance on perceptual task.” [23] In a previous study, a mere audiogram test was found to be affected by cognitive function level [26]. The Snellen chart, which is used to evaluate visual acuity also includes various letters and symbols, making it difficult to completely exclude the effect of cognitive function. However, participants of this study were initially non-demented. Considering the sensory function test has a relatively simple procedure, we can assume that performance deterioration due to cognitive impairment has negatively affected the sensory function evaluation.
The third suggests that “Impoverished perceptual input directly impacts cognitive resources.” [23] If the perceptual input is poor, additional cognitive resources are recruited to interpret it. Hence, the decrease in sensory function causes a decrease in test performance to evaluate cognitive function [27]. The outcome of this study was the incidence of dementia (diagnosis by a clinician). However, clinical diagnosis of dementia requires a decrease in neuropsychological test performance, and a decrease in cognitive function and daily living functions based on the patient’s and caregiver’s medical history report [28]. Therefore, we can posit that the increase in the incidence of dementia reported in this study is not sufficiently explained by the increase in cognitive loading alone.
Fourth, “The presence of sensory impairment results in cognitive decline due to sensory deprivation.’’ Long-term sensory deterioration leads to persistent strain in cognition, which in turn leads to breakdown and exhaustion of cognitive performance [23]. The previous studies’ findings, which suggested that the decrease in brain volume furthers in the presence of aging-related hearing loss, also support this hypothesis [29]. According to the sensitivity analysis of this study, sensory impairment preceded the onset of dementia. So, the decline in cognitive function due to continued sensory deprivation may have ultimately led to the onset of dementia.
The strength of this study is how unlike previous large-scale studies [7-10], objective mechanical devices and standardized tests were used for visual and auditory impairment evaluation, and thus, discovering that a reliable measurement was possible, avoiding various biases. Furthermore, we could confirm the independent effect of sensory impairment on the incidence of dementia by adjusting various demographic variables and comorbid diseases, as well as SES and lifestyle using national health checkup data. Moreover, through sensitivity analysis, we concluded that sensory impairments precede the onset of dementia, which has meaningful implications in the study of mechanisms related to revealing the relationship between the two phenomena. Lastly, although it was not replicated in the main analysis, the sensitivity analysis showed that ASI and VSI synergistically raised the incidence of dementia, suggesting the possibility that the two sensory impairments synergistically increase the risk of dementia with independent mechanisms.
However, this study also has few limitations. First, the dementia outcome in this study, defined operationally by disease code and prescriptions, may not completely match the actual dementia patients. This is an innate limitation of studies that use insurance claim data [17]. Although there is a possibility of bias in insurance data based on clinical practice, the findings may still reflect real-world scenarios. In the future, if a cohort study with a similar design yields similar findings, the evidence of this study can be ascertained.
Second, the severity of visual and auditory impairment was not measured in this study. Visual acuity was measured quantitatively, but the categorized variable was used with 0.3 as a cutoff. In future research, including the results of a stricter quantitative hearing test (e.g., pure tone audiometry) and analyzing the degree of sensory impairment through diversification will be necessary. Lastly, this study sample included only the individuals from Seoul, not the overall older population in Korea. This was due to restrictions on data reception. However, as the capital of Korea, Seoul accommodates nearly 10 million people, making its case for demographic representation. Thus, a future study should consider extracting a population sample from all regions of Korea through a statistical sampling. Finally, in this study, the use of hearing aids was not considered in defining the ASI group. If the use of a hearing aid was considered, it would have been possible to select a group in which therapeutic intervention was involved due to hearing difficulties in daily life, which would have suggested a new direction for study in the interpretation of the study’s findings. Furthermore, if a subgroup analysis was performed according to the use of a hearing aid, the effect of therapeutic intervention on the association between ASI and dementia incidence would have been checked.
Finally, although this study excluded people diagnosed with existing dementia, it did not exclude those with cognitive decline at the level of mild cognitive impairment (MCI) or those taking cognitive enhancers. If we had excluded these groups, we could have analyzed a pure cognitive normal group, which could have produced different results. However, previous big data studies have lacked consensus on the operational definitions for the MCI group based on diagnosis and medication codes. It is possible that the group taking cognitive enhancers could be a false-positive group with no cognitive decline. Therefore, the analysis was not initially performed during the study. Future studies should derive a pure cognitive normal group through a more elaborate operational definition.
In conclusion, this study found, the incidence of dementia significantly increased in people with visual or auditory impairment. Moreover, the risk was more increased when visual and auditory impairments coexisted. Therefore, in terms of public health, selecting and continuously managing the older group with sensory impairment as a high-risk group for dementia is expected to reduce its incidence.