Psychiatry Investig Search

CLOSE


Psychiatry Investig > Volume 18(6); 2021 > Article
Lim, Kim, Seo, Kang, Kim, Kang, Choi, Tae, Ham, and Han: Association of Prefrontal Cortex Thinning with High Impulsivity in Healthy Adults

Abstract

Objective

Studies have been conducted to identify brain structural alterations related to high impulsivity in psychiatric populations. However, research on healthy subjects is relatively less extensive. Therefore, we aimed to investigate the correlation between the cortical thickness of whole brain regions and the impulsivity level in a healthy population.

Methods

We included 100 healthy participants aged 19-65 years. Their T1-weighted magnetic resonance images and the 23-item Barratt Impulsiveness Scale (BIS) score were obtained. The patients were divided into high and low impulsivity groups according to the 75th percentile score of the BIS in the sample. The thickness of each cortical region was calculated using the FreeSurfer, and the difference in cortical thickness of the whole brain between the high and low impulsivity groups was analyzed using one-way analysis of covariance including age, sex, education level, and total intracranial cavity volume as covariates.

Results

The high impulsivity group showed significant cortical thinning in the left pars opercularis. The cortical thickness of the left pars opercularis significantly correlated negatively with the total, attention, and motor scores of the BIS scale.

Conclusion

Our findings suggest that prefrontal cortex thinning may play an important role in the development of high impulsivity in healthy adults.

INTRODUCTION

Impulsivity is known as the tendency to react immediately to a stimulus and to behave in an unplanned manner without carefully reckoning the outcome of the action [1,2]. People with high impulsivity tend to engage in risky and rash behavior and have difficulty adhering to set instructions [1]. High impulsivity is related to addiction, such as substance use disorders and behavioral addiction like gambling disorder [3-5], increased suicide ideation [6], increased suicide attempts, and violence of the suicide attempt [6,7]. Impulsivity can be a symptom of some psychopathological conditions, such as attention-deficit/hyperactivity disorder [8,9], major depressive disorder (MDD) [10], and anxiety disorders [11]. It can also be a trait of some personality types, such as antisocial personality disorder and borderline personality disorder [1,12].
The neural mechanisms of impulsivity have not been fully explained; several studies have attempted to identify the brain regions responsible for impulsivity and identify the related neural circuitry. Brain lesion studies have identified that frontal lobe lesions, especially prefrontal cortex (PFC) lesions, lead to an increase in impulsivity [13,14]. Functional neuroimaging studies have shown that the PFC is engaged in the control of impulsivity. Increased activity in the orbitofrontal cortex (OFC) has been associated with decreased impulsivity in adults [15] and adolescents [7] with borderline personality disorders. Experimental evidence using transcranial direct current stimulation showed that stimulation of the right dorsolateral PFC (dlPFC) decreased impulsivity [16]. The right inferior frontal gyrus and pre-supplementary motor area activity also correlate negatively with increasing attentional impulsivity scores [17].
Extensive structural neuroimaging studies have investigated the correlation between the PFC and impulsivity in terms of cortical thickness, gray matter volume, and white matter integrity. The cortical thickness of the OFC, superior frontal gyrus, and middle frontal gyrus correlates negatively with the impulsivity level in healthy subjects [18,19]. In a study of adolescents, impulsive decision-making showed a strong negative correlation with cortical thickness in the ventromedial PFC, OFC, temporal pole, and temporoparietal junction [20]. Another study suggested reduced cortical thickness in the frontal pole, rostral middle frontal gyrus, and pars orbitalis in healthy children and adolescents with high level of impulaivity [21]. These findings suggest that the cortical thinning of brain areas known to be involved in higher cognitive functions is associated with increased impulsivity. Regarding gray matter volume, the volume of the OFC [22,23] and dorsomedial PFC, right temporal pole, and left ventral striatum [24] correlate negatively with the impulsivity level in healthy subjects, while, gray and white matter volumes of the left anterior cingulate gyrus, left medial frontal gyrus, and left middle frontal gyrus positively correlate with impulsivity in healthy subjects [25].
As mentioned above, many studies have attempted to clarify the neural correlates of impulsivity since it constitutes a significant axis of personality traits in human psychology. However, the characteristic neurobiology of impulsivity is not completely understood. Accumulating evidence suggests a core role of the PFC in impulsivity control [18,19]. However, although the studies have identified that structural changes in the PFC are correlated with impulsivity, the involved sub-regions in the PFC vary in each study [18-25]. This makes further structural neuroimaging studies of impulsivity elucidating its neural correlation useful. Therefore, we aimed to investigate the correlation between the cortical thickness of whole brain regions and impulsivity, measured using the 23-item Barratt Impulsiveness Scale (BIS) in a non-clinical population. The BIS is widely used in psychiatric or psychological studies on impulsivity [1,26]. We divided the non-clinical participants into high and low impulsivity groups and compared the cortical thickness. By dividing the participants into high and low impulsivity groups, we found distinct brain regions that showed significant structural changes in the high impulsivity group.
Our a priori hypothesis is that non-clinical individuals in the high impulsivity group will have thinner cortical gray matter in the PFC compared to those in the low impulsivity group. Furthermore, we aimed to identify a more specific sub-region in the PFC that shows cortical thinning in the high impulsivity group.

METHODS

Participants

The present study included 100 healthy participants aged 19-65 years recruited from the community using an advertisement between February 2010 and December 2017. The participants were assessed by two board-certified psychiatrists (Han KM and Ham BJ), who confirmed that none of the participants had any current or previous psychiatric diseases. The exclusion criteria were: 1) any psychiatric disorders (including personality and substance use disorders) on the DSM-IV-TR (Diagnostic and Statistical Manual of Mental Disorders, Fourth Edition, Text-revised); 2) history of taking psychotropic medications within the last 6 months; 3) primary neurological illness (e.g., Parkinson’s disease, epilepsy, or cerebrovascular disease); 4) any contraindication for magnetic resonance imaging (MRI), including claustrophobia. The severity of depressive symptoms in all subjects was assessed using the 17-item Hamilton Depression Rating Scale (HDRS) [27] on the day of the MRI scan. Participants were also assessed using the BIS at the same time [28]. The study protocol was approved by the Institutional Review Board of the Korea University Anam Hospital (IRB No. 2017AN0185) and the study was conducted in accordance with the Declaration of Helsinki. All participants provided written informed consent prior to participation.

Assessment of impulsivity

The participants’ degree of impulsivity was measured using the 23-item Korean version of the BIS. The original version of the BIS, 11th edition [26] was translated into Korean [29], and the Korean version of the BIS was standardized in the Korean population [30]. The Korean version of the BIS is a self-reporting questionnaire consisting of 23 items with 4-point Likert scale (1=never to 4=always) and has shown high reliability in previous studies [31,32]. The BIS consists of three subscales-attention (a lack of focus on the ongoing task, 6 items), motor (acting without thinking, 8 items), and non-planning (orientation to the present rather than to the future, 9 items) [31,33]. Higher scores indicate higher degrees of impulsivity. The Korean version of the BIS has been widely used in psychiatric studies on impulsivity [34-37]. In the present study, both total and subscale scores were used. There is no cut-off score for the BIS, therefore, we determined that the high impulsivity group has a 53 or higher total BIS score-which is a 75th percentile score in our sample, while the low impulsivity group has a total BIS score of 52 or lower.

MRI data acquisition

In the present study, T1-weighted images were obtained parallel to the anterior commissure-posterior commissure line using a 3.0-T Siemens Trio whole-body imaging system (Siemens Healthineers, Munich, Germany), using T1-weighted magnetization-prepared rapid gradient-echo with the following parameters: repetition time, 1,900 ms; echo time, 2.6 ms; field of view, 220 mm; matrix size, 256×256; slice thickness, 1 mm; coronal slices without gap, 176; voxels, 0.86×0.86×1 mm3; flip angle, 16°; and number of excitations, 1.

Image processing

From the T1 image data obtained from the participants, we calculated the cortical thickness using the three-dimensional model of the cortical surface reconstructions implemented in the FreeSurfer version 5.3 (Laboratory for Computational Neuroimaging, Athinoula A. Martinos Center for Biomedical Imaging, Charlestown, MA, USA; http://surfer.nmr.mgh.harvard.edu). Based on the atlas by Destrieux et al. [38], each hemisphere was parcellated into 74 cortical gyri and sulci, and then, we extracted cortical thickness values of 38 cortical gyri from each hemisphere using automated processes in the FreeSurfer [39]. The cortical thickness was determined by calculating the distance between the pia mater and white matter surface using the surface deformation algorithm [40]. We inspected cortical reconstructions for the automatic segmentation of gray and white matter boundaries, and data with inaccuracies were discarded. Smoothing of the cortical map was performed using a Gaussian kernel with a full width at half maximum of 20 mm for all cortex analyses. Detailed information about the protocol of procedures in the FreeSurfer have been described in our previous publications [39-42]. We also measured total intracranial cavity volume (TICV) manually based on previous literature [43], and TICV was used as a covariate in the analysis.

Statistical analyses

The comparison of cortical thickness between the high and low impulsivity groups was performed using one-way analysis of covariance (ANCOVA), including cortical thickness as the dependent variable, group (high vs. low impulsivity group) as independent variables, and age, sex, education level, and TICV as covariates. The extracted cortical thickness values of 76 cortical gyri in the bilateral hemispheres from automated procedures of the FreeSurfer were used in the analysis. We applied the Bonferroni correction to the multiple comparisons in the main analysis to avoid type I error [i.e., p<0.05/76=0.000657 (76 cortical regions in the bilateral hemispheres)]. To investigate the correlation between the BIS score and cortical thickness, Pearson’s partial correlation analysis, including age, sex, education level, and TICV as covariates, was performed for cortical regions with significant differences between the two groups (p<0.05). All statistical analyses were performed using IBM SPSS Statistics for Windows, Version 24.0 (IBM Corporation, Armonk, NY, USA).

RESULTS

Sociodemographic and psychological characteristics

Information regarding age, sex, education level, total and sub-score of BIS, HDRS score, and TICV is shown in Table 1. The high impulsivity group showed significantly higher total BIS scores and sub-scores in attention, motor, and non-planning compared to the low impulsivity group (p<0.001 for all, Table 1). We did not find any significant differences in terms of age, sex, education level, HDRS score, and TICV (p>0.05, Table 1).

Cortical thickness difference between the groups

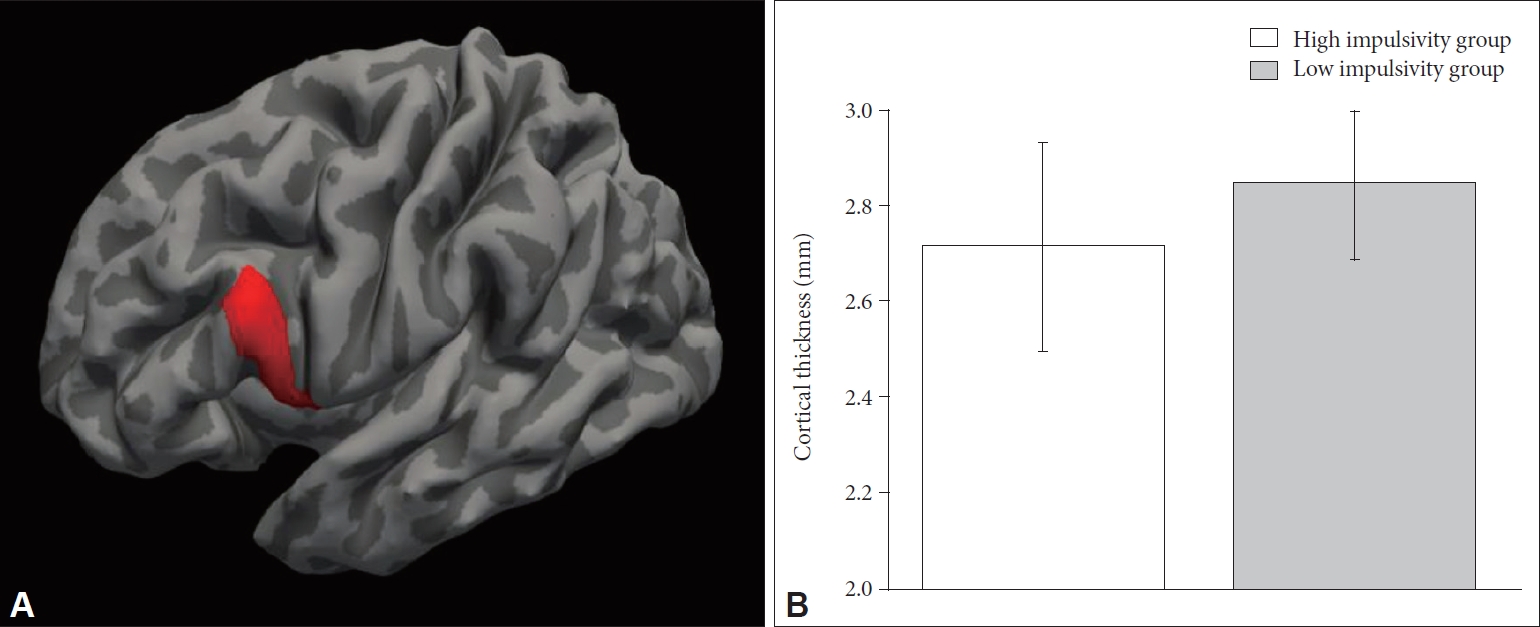
The high impulsivity group showed significant cortical thinning in the pars opercularis (inferior frontal gyrus) in the left hemisphere compared to the low impulsivity group (F(1, 94)=13.380, p=4.19×10⁻⁴) (Table 2, Figure 1). This finding remained significant after Bonferroni correction. The high impulsivity group also showed cortical thinning in the anterior cingulate gyrus, inferior occipital gyrus, supramarginal gyrus, lateral superior temporal gyrus, inferior temporal gyrus in the bilateral hemispheres, parahippocampal gyrus, angular gyrus, and planum polare in the left hemisphere, and subcentral gyrus, orbital gyrus, and straight gyrus in the right hemisphere than in the low impulsivity group (p<0.05 for all) (Table 2). However, these differences were not significant after Bonferroni correction. None of the cortical regions showed significant thickening in the high impulsivity group compared to the low impulsivity group.
As an exploratory analysis, we examined whether sex and age have moderating effects on the association between impulsivity level and cortical thickness in healthy adults. The total sample was sub-grouped based on sex and age (i.e., 19-39 years vs. ≥40 years), and the cortical thickness was compared between the high and low impulsivity groups. We found that cortical thinning of the left pars opercularis was only observed in female (F(1, 38)=11.420, p=0.002) and younger (F(1, 51)=10.510, p=0.002) participants, but not in male or older participants (both p>0.1). However, these findings were not significant after Bonferroni correction. Detailed information and findings of other cortical regions are presented in the Supplementary Materials (in the online-only Data Supplement) (Supplementary Tables 1-4 in the online-only Data Supplement).

Exploratory correlation analysis between the BIS score and cortical thickness

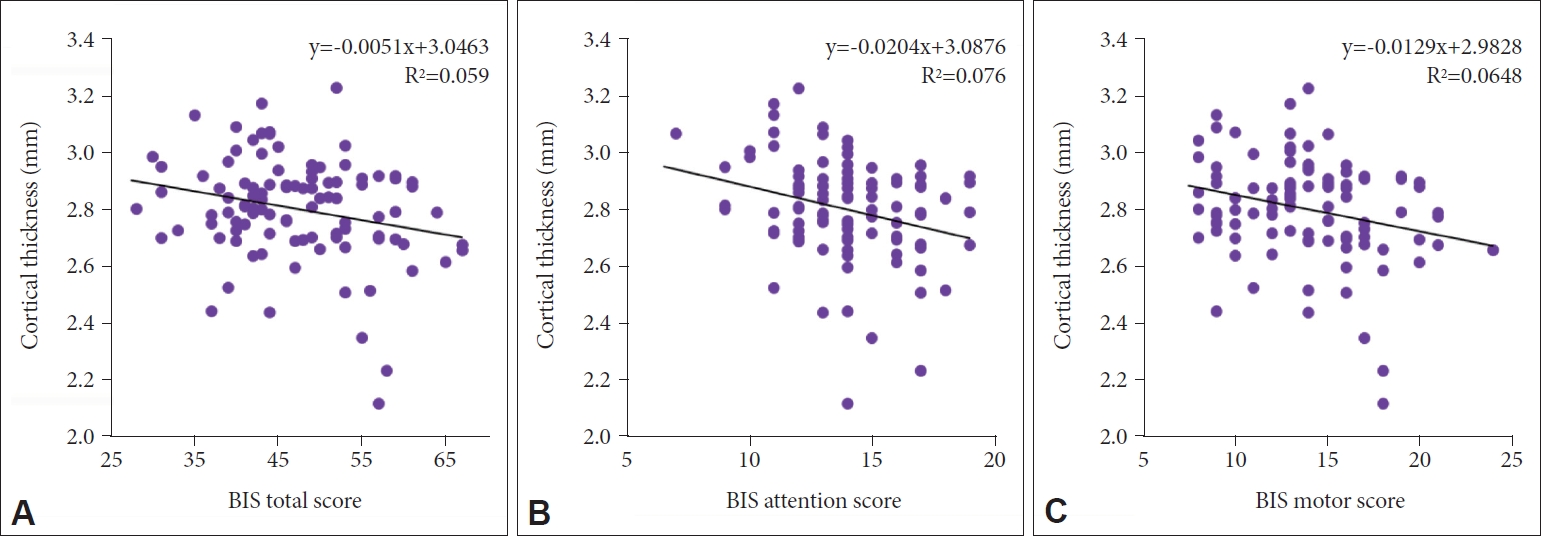
As an exploratory analysis, we performed Pearson’s partial correlation analyses on the left pars opercularis and aforementioned 16 cortical regions with significant differences in thickness between the two groups at a level of p<0.05 (Table 3). To investigate the correlation between the BIS score and cortical thickness, Pearson’s partial correlation analysis, including age, sex, education level, and TICV as covariates was performed. In the correlation analysis, the cortical thickness of the left pars opercularis showed a significant inverse correlation with the total score (r=-0.277, p=0.006) and attention (r=-0.294, p=0.004) and motor sub-scores (r=-0.286, p=0.005) of the BIS, but not with the non-planning sub-score (Table 3, Figure 2). The total BIS score also inversely correlated with cortical thickness in the left parahippocampal gyrus (r=-0.233, p=0.022), left inferior temporal gyrus (r=-0.239, p=0.019), right subcentral gyrus (r=-0.294, p=0.004), right anterior cingulate gyrus (r=-0.236, p=0.021), and right orbital gyrus (r=-0.208, p=0.042).

DISCUSSION

Our results show cortical thinning in the pars opercularis (inferior frontal gyrus) in the left hemisphere in the high impulsivity group, which was significant after Bonferroni correction. We also observed that the cortical thickness of the left pars opercularis had significant negative correlations with the total, attention, and motor scores of the BIS scale. Moreover, the BIS total score correlated negatively with the cortical thickness of the left parahippocampal gyrus, left inferior temporal gyrus, right subcentral gyrus, right anterior cingulate gyrus, and right orbital gyrus, which showed cortical thinning in the high impulsivity group, but was not significant after Bonferroni correction compared to the low impulsivity group. In the exploratory analysis, we also observed that sex and age have moderating effects on the association between impulsivity level and cortical thickness; however, they were not significant after Bonferroni correction.
Previous studies have reported that the cortical thickness of the PFC is inversely correlated with impulsivity levels in both healthy and clinical populations [18,44]. This is in accordance with our findings. Compared to other regions in the PFC, however, pars opercularis, which corresponds to the ventrolateral prefrontal cortex (vlPFC) is a less evidently studied brain region in previous impulsivity studies [15,18,24,45-48]. Previous studies on the function of the vlPFC suggest that it is associated with motor inhibition, reflexive reorientation and action updating as well as in decision making [49-51]. Furthermore, the cortico-limbic model of emotion regulation in mood disorders suggests that vlPFC is associated with voluntary and cognitive regulation of negative emotions generated by the amygdala [52]. Another study suggested that the vlPFC activity is correlated positively with successful inhibition of motor impulsivity [53]. These findings indicate that vlPFC have regulatory role on emotion and inhibitory role in motor control, which all are related to impulse control. The decrease in cortical thickness, therefore, may be associated with a decreased level of impulsivity inhibitory function.
Further study may be required to explain the gray matter cortical thinning in the left vlPFC alone. This may be explained by the lateralization of hemispheric functions, since with dominance, the left and right hemispheres have different roles [54]. The exact mechanism for the functional lateralization of the PFC in impulse control cannot be clearly explained. However, previous studies on impulsivity have identified more regions in the left PFC than in the right PFC to be structurally correlated with impulsivity [18,19,24,25]. Therefore, based on the evidence from previous studies and the present study, the left PFC may be more involved in impulsivity control.
There are possible explanations for the decrease in cortical thickness of the pars opercularis in individuals with high impulsivity. Several biological mechanisms may account for this association. According to the Hebbian law, neurons “fire together wire together” [55]. This theory suggests that when neurons do not fire together, the connection slowly dissociates. Therefore, the number and volume of dendritic spines in the neurons decrease with a decrease in concurrent firing and its use [55]. As the activity in the PFC declines, the number and quality of neuronal connections may have decreased, showing a decrease in cortical thickness. Although the causal relationship between cortical thickness and impulsivity cannot be determined through this research, the decrease in the number of neurons may be associated with the decreased cortical thickness leading to an impaired function. In addition to neurons, astrocytes may account for the decrease in cortical thickness. Astrocytes take up about 20-40% of the brain volume [56], provide homeostasis, and support the neurons in the central nervous system [57]. Therefore, as the activities of the neurons in the PFC decrease, the number and volume of astrocytes may also decrease. With this change in astrocytes, the amount of vascularization may be altered, accounting for the change in cortical thickness.
Our research, as a cross-sectional study, successfully identified the cortical region involved in impulsivity in healthy adults; however, it still has several limitations. First, dividing the subjects into high and low impulsivity groups by the 75th percentile of the BIS-11 total score may seem arbitrary. Based on the recommendation of Stanford et al. [58], individuals with a total score of 72 or above should be considered to have high impulsivity. Our cut-off score was 53, which was lower than the suggested upper cut-off score. However, they recommended considering individuals with total scores of 52 or below to be extremely over-controlled, suggesting a lower cut-off score [58]. A BIS-11 total score of 52 corresponded to the 75th percentile score of our subjects, 53. Taking the score distribution of our subjects and the cut-off scores of previous studies on the BIS scale, our standard of grouping may be appropriate. Second, since our study was a cross-sectional study, it could not determine the causal relationship between cortical thickness and impulsivity, which is a limitation of all cross-sectional studies. Nonetheless, our study provides a neuroimaging biomarker for impulsivity in healthy subjects in a cross-sectional design, which may be extensively studied in a future study. A future longitudinal follow-up study may provide a causal relationship between impulsivity and cortical thickness.
In conclusion, we observed that the healthy adults with high impulsivity traits showed a thinner cortex in the left pars opercularis compared to those with low impulsivity traits. We also observed that cortical thickness of the left pars opercularis had a significant negative correlation with the total, attention, and motor scores of the BIS scale. As left pars opercularis is significant in motor control, human mirror neuron system and the language production, our research suggests that the highly impulsive individuals may have some functional alteration with left pars opercularis cortical thinning. Further studies should be conducted to confirm the suggested functional alteration in the highly impulsive individuals with left pars opercularis thinning.

Supplementary Materials

The online-only Data Supplement is available with this article at https://doi.org/10.30773/pi.2020.0404.

ACKNOWLEDGEMENTS

This research was supported by a Korea University Grant (K1925151).

The authors have no potential conflicts of interest to disclose.

Author Contributions

Conceptualization: Kyu-Man Han. Data curation: Kyu-Man Han. Formal analysis: Kyu-Man Han. Funding acquisition: Kyu-Man Han. Investigation: Ji-Eun Lim, Seoyeon Kim, Surin Seo. Methodology: Kyu-Man Han. Project administration: Wooyoung Kang, Youbin Kang, Aram Kim. Resources: Byung-Joo Ham, Wooyoung Kang, Youbin Kang, Aram Kim. Software: Kyu-Man Han. Supervision: Byung-Joo Ham, Woo-Suk Tae. Validation: Kwan Woo Choi. Visualization: Wooyoung Kang, Youbin Kang. Writing—original draft: Ji-Eun Lim, Seoyeon Kim, Surin Seo, Kyu-Man Han. Writing—review & editing: Ji-Eun Lim, Seoyeon Kim, Surin Seo, Kyu-Man Han.

Figure 1.
Cortical thinning of the left pars opercularis in the high impulsivity group. (A) shows the left pars opercularis (inferior frontal gyrus) in the Destrieux atlas (Red colored brain region). (B) shows a comparison of the cortical thickness of the left pars opercularis between the high and low impulsivity groups. The error bar represents one standard deviation.
pi-2020-0404f1.jpg
Figure 2.
Correlation between BIS score and cortical thickness of the left pars opercularis. (A-C) show scatter plots of the correlations of cortical thickness of the left pars opercularis with the total, attention, and motor scores of the BIS, respectively. BIS: Barratt Impulsiveness Scale.
pi-2020-0404f2.jpg
Table 1.
Sociodemographic and clinical characteristics of participants
Characteristics Total (N=100) High (N=28) Low (N=72) p value (t, χ2)
Age 38.84±13.33 39.54±15.12 38.57±12.67 0.766 (t=0.300)
Sex
 Female 57 12 45 0.075 (χ2=3.174)
 Male 43 16 27
Education level
 Elementary and middle school 14 2 12 0.463 (χ2=1.542)
 High school or college/university 72 22 50
 Above graduate school 14 4 10
HDRS score 1.53±1.82 1.29±1.51 1.63±1.92 0.405 (t=-0.837)
BIS (total) 47.20±8.63 58.00±4.16 43.00±5.78 <0.001 (t=12.511)
BIS (attention) 13.89±2.46 16.32±1.83 12.94±1.99 <0.001 (t=7.805)
BIS (motor) 13.87±3.60 18.00±2.31 12.26±2.60 <0.001 (t=10.223)
BIS (non-planning) 19.44±4.02 23.68±2.74 17.79±3.144 <0.001 (t=8.703)
TICV (cm3) 1506.53±137.01 1516.89±164.22 1502.50±125.94 0.640 (t=0.470)

Data are presented as mean±standard deviation for age, HDRS-17 scores, and BIS scores. The p values for the distribution of sex and education level were obtained using a chi-squared test. High group: BIS=53 or higher; Low group: BIS=52 or lower (75%ile score was 53). BIS: Barratt Impulsiveness Scale, HDRS: 17-item Hamilton Depression Rating Scale, TICV: total intracranial cavity volume

Table 2.
Comparison of cortical thickness between high and low impulsivity group
Cortical regions High group (N=28)
Low group (N=72)
F(1, 94) p-value
Mean SD Mean SD
Left hemisphere
 L Frontomarginal gyrus 2.341 0.137 2.359 0.170 0.804 0.372
 L Inferior occipital gyrus 2.493 0.184 2.570 0.195 4.226 0.043
 L Paracentral lobule 2.366 0.210 2.424 0.170 0.704 0.404
 L Subcentral gyrus 2.693 0.198 2.729 0.170 0.807 0.371
 L Transverse frontopolar gyrus 2.589 0.208 2.672 0.208 2.101 0.151
 L Anterior cingulate gyrus 2.723 0.161 2.789 0.147 4.181 0.044
 L Anterior mid-cingulate gyrus 2.679 0.154 2.731 0.159 1.525 0.220
 L Posterior mid-cingulate gyrus 2.560 0.221 2.595 0.185 0.826 0.366
 L Dorsal posterior cingulate gyrus 2.654 0.485 2.797 0.425 2.544 0.114
 L Ventral posterior cingulate gyrus 2.490 0.287 2.570 0.286 3.825 0.053
 L Cuneus 1.861 0.318 1.842 0.357 0.295 0.588
 L Pars opercularis 2.711 0.217 2.841 0.154 13.380 4.19×10⁻⁴
 L Pars orbitalis 2.682 0.308 2.806 0.214 3.625 0.060
 L Pars triangularis 2.666 0.190 2.718 0.176 0.815 0.369
 L Middle frontal gyrus 2.748 0.233 2.763 0.169 0.068 0.794
 L Superior frontal gyrus 3.010 0.268 3.054 0.242 0.232 0.631
 L Long insular gyrus 2.907 0.292 3.007 0.258 2.184 0.143
 L Short insular gyrus 3.173 0.564 3.359 0.492 2.241 0.138
 L Middle occipital gyrus 2.542 0.185 2.603 0.158 2.489 0.118
 L Superior occipital gyrus 2.082 0.245 2.134 0.201 1.079 0.302
 L Lateral occipito-temporal gyrus 2.739 0.327 2.783 0.240 0.828 0.365
 L Lingual gyrus 1.999 0.258 1.946 0.223 0.932 0.337
 L Parahippocampal gyrus 2.866 0.275 2.977 0.224 4.977 0.028
 L Orbital gyrus 2.650 0.171 2.694 0.172 0.764 0.384
 L Angular gyrus 2.593 0.182 2.678 0.164 4.329 0.040
 L Supramarginal gyrus 2.606 0.314 2.749 0.250 5.515 0.021
 L Superior parietal lobule 2.429 0.202 2.441 0.147 0.014 0.907
 L Postcentral gyrus 2.180 0.167 2.245 0.177 1.627 0.205
 L Precentral gyrus 2.778 0.209 2.840 0.204 0.998 0.320
 L Precuneus 2.467 0.181 2.531 0.145 2.657 0.106
 L Straight gyrus 2.534 0.299 2.653 0.337 3.779 0.055
 L Subcallosal gyrus 2.469 0.295 2.500 0.414 0.001 0.978
 L Anterior transverse temporal gyrus 2.416 0.431 2.309 0.397 2.898 0.092
 L Lateral superior temporal gyrus 2.903 0.261 3.035 0.263 4.258 0.042
 L Planum polare 3.233 0.355 3.377 0.295 5.249 0.024
 L Planum temporale 2.569 0.200 2.653 0.207 2.597 0.110
 L Inferior temporal gyrus 2.748 0.291 2.917 0.266 9.316 0.003
 L Middle temporal gyrus 2.960 0.316 3.043 0.248 2.443 0.121
Right hemisphere
 R Frontomarginal gyrus 2.339 0.220 2.396 0.173 1.731 0.191
 R Inferior occipital gyrus 2.629 0.214 2.714 0.211 5.123 0.026
 R Paracentral lobule 2.395 0.197 2.408 0.210 0.009 0.923
 R Subcentral gyrus 2.653 0.166 2.766 0.179 7.433 0.008
 R Transverse frontopolar gyrus 2.616 0.193 2.645 0.181 0.130 0.719
 R Anterior cingulate gyrus 2.698 0.157 2.775 0.139 6.199 0.015
 R Anterior mid-cingulate gyrus 2.778 0.161 2.816 0.124 1.118 0.293
 R Posterior mid-cingulate gyrus 2.632 0.135 2.638 0.198 0.029 0.864
 R Dorsal posterior cingulate gyrus 2.697 0.479 2.830 0.401 2.621 0.109
 R Ventral posterior cingulate gyrus 2.586 0.313 2.668 0.313 3.302 0.072
 R Cuneus 1.911 0.350 1.863 0.316 0.877 0.352
 R Pars opercularis 2.775 0.170 2.835 0.174 2.312 0.132
 R Pars orbitalis 2.721 0.209 2.827 0.218 3.647 0.059
 R Pars triangularis 2.684 0.158 2.752 0.162 3.379 0.069
 R Middle frontal gyrus 2.772 0.258 2.809 0.201 0.189 0.665
 R Superior frontal gyrus 3.031 0.260 3.050 0.220 0.000 0.993
 R Long insular gyrus 3.005 0.388 3.102 0.315 0.897 0.346
 R Short insular gyrus 3.053 0.552 3.215 0.438 2.118 0.149
 R Middle occipital gyrus 2.585 0.168 2.631 0.167 1.690 0.197
 R Superior occipital gyrus 2.112 0.210 2.174 0.176 1.632 0.205
 R Lateral occipito-temporal gyrus 2.753 0.301 2.794 0.197 1.194 0.277
 R Lingual gyrus 2.072 0.264 1.994 0.233 2.205 0.141
 R Parahippocampal gyrus 2.969 0.349 3.053 0.276 1.597 0.209
 R Orbital gyrus 2.637 0.194 2.745 0.180 4.753 0.032
 R Angular gyrus 2.587 0.196 2.667 0.147 3.867 0.052
 R Supramarginal gyrus 2.564 0.323 2.717 0.269 5.242 0.024
 R Superior parietal lobule 2.382 0.182 2.426 0.150 1.002 0.319
 R Postcentral gyrus 2.126 0.184 2.210 0.177 2.434 0.122
 R Precentral gyrus 2.768 0.239 2.825 0.171 1.601 0.209
 R Precuneus 2.516 0.199 2.549 0.185 0.368 0.545
 R Straight gyrus 2.520 0.321 2.659 0.267 4.755 0.032
 R Subcallosal gyrus 2.616 0.484 2.616 0.497 0.009 0.926
 R Anterior transverse temporal gyrus 2.407 0.416 2.414 0.382 0.091 0.763
 R Lateral superior temporal gyrus 2.887 0.316 3.040 0.280 5.056 0.027
 R Planum polare 3.118 0.359 3.159 0.289 0.570 0.452
 R Planum temporale 2.600 0.193 2.632 0.212 0.087 0.769
 R Inferior temporal gyrus 2.796 0.299 2.923 0.256 4.282 0.041
 R Middle temporal gyrus 2.896 0.289 3.012 0.257 3.738 0.056

One-way ANCOVA including age, sex, education level, and total intracranial volume as covariates, was performed. Significant group differences after Bonferroni correction were presented in a bold face. Bonferroni correction was applied for multiple comparisons: p<0.05/76=0.000658. L: left hemisphere, R: right hemisphere

Table 3.
Correlation between cortical thickness and impulsivity
Cortical regions Total
Attention
Motor
Non-planning
r p-value r p-value r p-value r p-value
L Inferior occipital gyrus -0.181 0.078 -0.141 0.169 -0.228 0.026 -0.096 0.350
L Anterior cingulate gyrus -0.166 0.105 -0.166 0.107 -0.171 0.096 -0.102 0.321
L Pars opercularis -0.277 0.006 -0.294 0.004 -0.286 0.005 -0.156 0.129
L Parahippocampal gyrus -0.233 0.022 -0.171 0.095 -0.253 0.013 -0.170 0.098
L Angular gyrus -0.175 0.088 -0.112 0.279 -0.162 0.114 -0.164 0.111
L Supramarginal gyrus -0.177 0.085 -0.208 0.042 -0.143 0.164 -0.124 0.230
L Lateral superior temporal gyrus -0.125 0.223 -0.106 0.304 -0.153 0.135 -0.066 0.523
L Planum polare -0.185 0.071 -0.211 0.039 -0.150 0.145 -0.133 0.196
L Inferior temporal gyrus -0.239 0.019 -0.210 0.040 -0.263 0.010 -0.149 0.147
R Inferior occipital gyrus -0.186 0.070 -0.204 0.046 -0.154 0.135 -0.136 0.188
R Subcentral gyrus -0.294 0.004 -0.235 0.021 -0.268 0.008 -0.250 0.014
R Anterior cingulate gyrus -0.236 0.021 -0.203 0.048 -0.240 0.018 -0.167 0.104
R Orbital gyrus -0.208 0.042 -0.094 0.360 -0.255 0.012 -0.160 0.120
R Supramarginal gyrus -0.159 0.122 -0.191 0.062 -0.119 0.248 -0.118 0.254
R Straight gyrus -0.185 0.071 -0.176 0.085 -0.170 0.097 -0.138 0.181
R Lateral superior temporal gyrus -0.145 0.158 -0.143 0.165 -0.151 0.143 -0.089 0.391
R Inferior temporal gyrus -0.122 0.236 -0.186 0.070 -0.153 0.136 -0.008 0.940

Pearson’s partial correlation adjusted for age, sex, education level, and total intracranial cavity volume was performed. L: left hemisphere, R: right hemisphere

REFERENCES

1. Bakhshani NM. Impulsivity: a predisposition toward risky behaviors. Int J High Risk Behav Addict 2014;3:e20428
crossref pmid pmc
2. Nigg JT, Silk KR, Stavro G, Miller T. Disinhibition and borderline personality disorder. Dev Psychopathol 2005;17:1129-1149.
crossref pmid
3. Fillmore MT, Rush CR. Impaired inhibitory control of behavior in chronic cocaine users. Drug Alcohol Depend 2002;66:265-273.
crossref pmid
4. Kirby KN, Petry NM. Heroin and cocaine abusers have higher discount rates for delayed rewards than alcoholics or non-drug-using controls. Addiction 2004;99:461-471.
crossref pmid
5. Lane SD, Cherek DR, Rhoades HM, Pietras CJ, Tcheremissine OV. Relationships among laboratory and psychometric measures of impulsivity: implications in substance abuse and dependence. Addict Disord Their Treat 2003;2:33-40.
crossref
6. Bhatt M, Perera S, Zielinski L, Eisen RB, Yeung S, El-Sheikh W, et al. Profile of suicide attempts and risk factors among psychiatric patients: a case-control study. PLoS One 2018;13:e0192998.
crossref pmid pmc
7. Whelan R, Conrod PJ, Poline JB, Lourdusamy A, Banaschewski T, Barker GJ, et al. Adolescent impulsivity phenotypes characterized by distinct brain networks. Nat Neurosci 2012;15:920-925.
crossref pmid
8. Nigg JT. Is ADHD a Disinhibitory Disorder? Psychol Bull 2001;127:571-598.
crossref pmid
9. Winstanley CA, Eagle DM, Robbins TW. Behavioral models of impulsivity in relation to ADHD: Translation between clinical and preclinical studies. Clin Psychol Rev 2006;26:379-395.
crossref pmid pmc
10. Carver CS, Johnson SL, Joormann J. Major depressive disorder and impulsive reactivity to emotion: Toward a dual-process view of depression. Br J Clin Psychol 2013;52:285-299.
crossref pmid pmc
11. Xia L, Gu R, Zhang D, Luo Y. Anxious individuals are impulsive decision-makers in the delay discounting task: An ERP study. Front Behav Neurosci 2017;11:5
crossref pmid pmc
12. Henry C, Mitropoulou V, New AS, Koenigsberg HW, Silverman J, Siever LJ. Affective instability and impulsivity in borderline personality and bipolar II disorders: similarities and differences. J Psychiatr Res 2001;35:307-312.
crossref pmid
13. Coccaro EF, Siever LJ, Klar HM, Maurer G, Cochrane K, Cooper TB, et al. Serotonergic studies in patients with affective and personality disorders. Correlates with suicidal and impulsive aggressive behavior. Arch Gen Psychiatry 1989;46:587-599.
crossref pmid
14. Bechara A, Damasio H, Damasio AR. Emotion, decision making and the orbitofrontal cortex. Cereb Cortex 2000;10:295-307.
crossref pmid
15. New AS, Buchsbaum MS, Hazlett EA, Goodman M, Koenigsberg HW, Lo J, et al. Fluoxetine increases relative metabolic rate in prefrontal cortex in impulsive aggression. Psychopharmacology (Berl) 2004;176:451-458.
crossref pmid
16. Beeli G, Casutt G, Baumgartner T, JÖncke L. Modulating presence and impulsiveness by external stimulation of the brain. Behav Brain Funct 2008;4:33
crossref pmid pmc
17. Bell RP, Garavan H, Foxe JJ. Neural correlates of craving and impulsivity in abstinent former cocaine users: Towards biomarkers of relapse risk. Neuropharmacology 2014;85:461-470.
crossref pmid pmc
18. Schilling C, Kuhn S, Romanowski A, Schubert F, Kathmann N, Gallinat J. Cortical thickness correlates with impulsiveness in healthy adults. Neuroimage 2012;59:824-830.
crossref pmid
19. Schilling C, Kühn S, Paus T, Romanowski A, Banaschewski T, Barbot A, et al. Cortical thickness of superior frontal cortex predicts impulsiveness and perceptual reasoning in adolescence. Mol Psychiatry 2013;18:624-630.
crossref pmid
20. Pehlivanova M, Wolf DH, Sotiras A, Kaczkurkin AN, Moore TM, Ciric R, et al. Diminished cortical thickness is associated with impulsive choice in adolescence. J Neurosci 2018;38:2471-2481.
crossref pmid pmc
21. Merz EC, He X, Noble KG. Anxiety, depression, impulsivity, and brain structure in children and adolescents. Neuroimage Clin 2018;20:243-251.
crossref pmid pmc
22. Matsuo K, Nicoletti M, Nemoto K, Hatch JP, Peluso MA, Nery FG, et al. A voxel-based morphometry study of frontal gray matter correlates of impulsivity. Hum Brain Mapp 2009;30:1188-1195.
crossref pmid
23. Mitchell MR, Potenza MN. Recent insights into the neurobiology of impulsivity. Curr Addict Rep 2014;1:309-319.
crossref pmid pmc
24. Muhlert N, Lawrence AD. Brain structure correlates of emotion-based rash impulsivity. Neuroimage 2015;115:138-146.
crossref pmid
25. Cho SS, Pellecchia G, Aminian K, Ray N, Segura B, Obeso I, et al. Morphometric correlation of impulsivity in medial prefrontal cortex. Brain Topogr 2013;26:479-487.
crossref pmid
26. Patton JH, Stanford MS, Barratt ES. Factor structure of the Barratt impulsiveness scale. J Clin Psychol 1995;51:768-774.
crossref pmid
27. Hamilton M. A rating scale for depression. J Neurol Neurosurg Psychiatry 1960;23:56-62.
crossref pmid pmc
28. Oldfield RC. The assessment and analysis of handedness: the Edinburgh inventory. Neuropsychologia 1971;9:97-113.
crossref pmid
29. Lee HS. Impulsivity Test. Seoul: Korea Guidance; 1992.

30. Chung Y, Lee C. A study of factor structures of the Barratt impulsiveness scale in Korean university students. Korean J Clin Psychol 1997;16:117-129.

31. Lee JD, Cho MJ, Sohn JH, Park S, Seong S, Ahn JH, et al. Evaluation of a functional model of acquired capability for suicide in a nationwide sample of Korean adults. Psychiatry Investig 2016;13:601-608.
crossref pmid pmc
32. Yeo SK, Lee WK. The relationship between adolescents’ academic stress, impulsivity, anxiety, and skin picking behavior. Asian J Psychiatr 2017;28:111-114.
crossref pmid
33. Kim D, Lee D, Lee J, Namkoong K, Jung YC. Association between childhood and adult attention deficit hyperactivity disorder symptoms in Korean young adults with Internet addiction. J Behav Addict 2017;6:345-353.
crossref pmid pmc
34. Han DH, Lyoo IK, Renshaw PF. Differential regional gray matter volumes in patients with on-line game addiction and professional gamers. J Psychiatr Res 2012;46:507-515.
crossref pmid pmc
35. Hwang JY, Kang SG, Gwak AR, Park J, Lee YJ. The associations of morningness-eveningness with anger and impulsivity in the general population. Chronobiol Int 2016;33:200-209.
crossref pmid
36. Kim J, Park S. Association between protective behavioral strategies and problem drinking among college students in the Republic of Korea. Addict Behav 2015;51:171-176.
crossref pmid
37. Park I, Oh SM, Lee KH, Kim S, Jeon JE, Lee HY, et al. The moderating effect of sleep disturbance on the association of stress with impulsivity and depressed mood. Psychiatry Investig 2020;17:243-248.
crossref pmid pmc
38. Destrieux C, Fischl B, Dale A, Halgren E. Automatic parcellation of human cortical gyri and sulci using standard anatomical nomenclature. Neuroimage 2010;53:1-15.
crossref pmid
39. Han KM, Han MR, Kim A, Kang W, Kang Y, Kang J, et al. A study combining whole-exome sequencing and structural neuroimaging analysis for major depressive disorder. J Affect Disord 2020;262:31-39.
crossref pmid
40. Han KM, Tae WS, Kim A, Kang Y, Kang W, Kang J, et al. Serum FAM19A5 levels: a novel biomarker for neuroinflammation and neurodegeneration in major depressive disorder. Brain Behav Immun 2020;87:852-859.
crossref pmid
41. Han KM, Choi S, Jung J, Na KS, Yoon HK, Lee MS, et al. Cortical thickness, cortical and subcortical volume, and white matter integrity in patients with their first episode of major depression. J Affect Disord 2014;155:42-48.
crossref pmid
42. Han KM, Won E, Sim Y, Kang J, Han C, Kim YK, et al. Influence of FKBP5 polymorphism and DNA methylation on structural changes of the brain in major depressive disorder. Sci Rep 2017;7:42621
crossref pmid pmc
43. Tae WS, Kim SS, Lee KU, Nam EC, Kim KW. Validation of hippocampal volumes measured using a manual method and two automated methods (FreeSurfer and IBASPM) in chronic major depressive disorder. Neuroradiology 2008;50:569-581.
crossref pmid
44. Fradkin Y, Khadka S, Bessette KL, Stevens MC. The relationship of impulsivity and cortical thickness in depressed and non-depressed adolescents. Brain Imaging Behav 2017;11:1515-1525.
crossref pmid
45. Schiffer B, Muller BW, Scherbaum N, Forsting M, Wiltfang J, Leygraf N, et al. Impulsivity-related brain volume deficits in schizophrenia-addiction comorbidity. Brain 2010;133:3093-3103.
crossref pmid
46. Mahon K, Burdick KE, Wu J, Ardekani BA, Szeszko PR. Relationship between suicidality and impulsivity in bipolar I disorder: a diffusion tensor imaging study. Bipolar Disord 2012;14:80-89.
crossref pmid pmc
47. Matsuo K, Nielsen N, Nicoletti MA, Hatch JP, Monkul ES, Watanabe Y, et al. Anterior genu corpus callosum and impulsivity in suicidal patients with bipolar disorder. Neurosci Lett 2010;469:75-80.
crossref pmid
48. Molnar-Szakacs I, Iacoboni M, Koski L, Mazziotta JC. Functional segregation within pars opercularis of the inferior frontal gyrus: evidence from fMRI studies of imitation and action observation. Cereb Cortex 2005;15:986-994.
crossref pmid
49. Levy BJ, Wagner AD. Cognitive control and right ventrolateral prefrontal cortex: reflexive reorienting, motor inhibition, and action updating. Ann N Y Acad Sci 2011;1224:40-62.
crossref pmid pmc
50. Sakagami M, Pan X, Uttl B. Behavioral inhibition and prefrontal cortex in decision-making. Neural Netw 2006;19:1255-1265.
crossref pmid
51. Sakagami M, Pan X. Functional role of the ventrolateral prefrontal cortex in decision making. Curr Opin Neurobiol 2007;17:228-233.
crossref pmid
52. Kupfer DJ, Frank E, Phillips ML. Major depressive disorder: new clinical, neurobiological, and treatment perspectives. Lancet 2012;379:1045-1055.
crossref pmid
53. Goya-Maldonado R, Walther S, Simon J, Stippich C, Weisbrod M, Kaiser S. Motor impulsivity and the ventrolateral prefrontal cortex. Psychiatry Res 2010;183:89-91.
crossref pmid
54. Noggle CA, Hall JJ. Hemispheres of the Brain, Lateralization of. In: Goldstein S, Naglieri JA, editor. Encyclopedia of Child Behavior and Development. Boston, MA: Springer US, 2011, p. 740-741.

55. Hebb DO. The Organization of Behavior A Neuropsychological Theory. New York: Psychology Press; 2012.

56. Verkhratsky A, Butt AM. Glial Physiology and Pathophysiology. West Sussex: Wiley-Blackwell; 2013.

57. Siracusa R, Fusco R, Cuzzocrea S. Astrocytes: role and functions in brain pathologies. Front Pharmacol 2019;10:1114
crossref pmid pmc
58. Stanford MS, Mathias CW, Dougherty DM, Lake SL, Anderson NE, Patton JH. Fifty years of the Barratt Impulsiveness Scale: an update and review. Pers Individ Dif 2009;47:385-395.
crossref


ABOUT
AUTHOR INFORMATION
ARTICLE CATEGORY

Browse all articles >

BROWSE ARTICLES
Editorial Office
#522, 27, Seochojungang-ro 24-gil, Seocho-gu, Seoul 06601, Korea
Tel: +82-2-717-0892    E-mail: psychiatryinvest@gmail.com                

Copyright © 2024 by Korean Neuropsychiatric Association.

Developed in M2PI

Close layer
prev next