Korean Anxiety Sensitivity Index-3: Its Factor Structure, Reliability, and Validity in Non-Clinical Samples
Article information
Abstract
Objective
The aim here is to examine the factorial structure, internal consistency, and concurrent validity of the Korean version of the Anxiety Sensitivity Index-3 (K-ASI-3) in student samples in Korea. Also, we investigated the cross-cultural differences in the Social Concerns factor.
Methods
K-ASI-3 was administered to non clinical samples in Korea. Internal consistency, exploratory factor analysis (EFA), and confirmatory factor analysis (CFA) were undertaken to examine the factorial structure and reliability of the K-ASI-3.
Results
Results from CFA comparing our data to factor solutions commonly reported as representative of European-American samples indicated an adequate fit. The K-ASI-3 showed good performance on the indices of internal consistency and concurrent validity. In addition, using regression analyses, we found the Social Concerns factor is most strongly related to life satisfaction and worry. However, we found no evidence that Korean college students express more Social Concerns than their European Caucasian counterparts.
Conclusion
The authors demonstrate that the K-ASI-3 has highly internally consistent and psychometrically sound items, and that it reliably measures three lower-order domains assessing Physical, Social, and Cognitive Concerns.
INTRODUCTION
Anxiety sensitivity (AS) refers to the fear of anxiety-related sensations that are interpreted as having potentially undesirable somatic, psychological, or social consequences.1 AS is a dispositional tendency that amplifies the intensity of emotional reactions, and plays a significant role in the etiology and maintenance of several anxiety disorders, particularly panic disorder.2
Dimensions of concerns associated with anxiety sensitivity
Researchers have identified three lower-order domains of concerns related to AS. The lower-order dimensions represent Physical Concerns, Cognitive Concerns, and Social Concerns. Some people are more apt to fear the physical symptoms of AS, believing that these symptoms are signs of physical illness. For example, a person might be worried by shortness of breath, thinking that it may lead to fainting or suffocating. Other people are more likely to fear cognitive symptoms of AS, due to beliefs that anxiety symptoms like derealization (an alteration in the perception or experience of the external world so that it seems strange or unreal) are signals of mental disorder. For example, some people are more concerned about the difficulty to focus their attention on task believing that they are going crazy. Still others may fear publicly observable symptoms due to beliefs that displaying anxiety will result in embarrassment, social criticism, and public ridicule. These people would be perplexed if others took notice of their nervousness or anxiety.
Research on these three factors has elucidated the nature of the relationship between AS and several types of anxiety-related disorders. For example, Physical Concerns are most strongly associated with panic disorder. Cognitive Concerns are more apt to be related to depression, whereas Social Concerns are most strongly associated with the fear of negative evaluation and to social phobia.3
Cultural differences in anxiety sensitivity
Culture may exert important influences on the experience and expression of AS.4 Previous studies have shown that AS can appear in different ways across various cultural contexts. Within some cultural groups, Physical Concerns which are associated with heart and respiratory sensations are more readily noticeable.5 For other cultural contexts, Cognitive Concerns are more prominent than any other dimensions.6 Researchers have indicated that Latin American children and adolescents express more AS than their white non-Latino counterparts.7,8 Because physiological sensations of anxiety are considered normative in Latino culture, high AS in Latin American youth possess a smaller tendency to amplify somatic complaints than in white non-Latino youth.9
According to the previous studies, East Asians in general report higher social anxiety than do Western people.10-13 Also, the previous studies postulated that Social Concerns dimension seems to play a central role in social phobia.14,15 Thus, we can presume that Koreans score higher on the Social Concerns than Westerners.
Although we expect that Koreans would have more Social Concerns, Social Concerns should not be immediately interpreted to psychopathology. The doorstep for negative implications associated with Social Concerns might be higher in Korea. Thus, it is requisite to examine if Social Concerns dimension may contribute more to the subjective well-being and general distress than the other dimensions of AS do in Koreans.
Anxiety Sensitivity Index-3
In order to assess AS, Reiss, Peterson, Gursky, and McNally16 developed the Anxiety Sensitivity Index (ASI) which is the most popular tool to measure AS. The ASI has demonstrated excellent reliability and validity properties with diverse samples.17 While the ASI showed sound psychometric properties, there have been inconsistencies of the factor structure of the ASI. Some research demonstrated that data favored a unifactorial solution which is identical to the original conceptualization of the ASI.16,18 However, some researchers found support for a three or four factor structure to the ASI.19,20 In Korean version, there also have been inconsistencies of the factor structure of the K-ASI. One study21 favored the unifactorial structure and another study22 demonstrated the four factor solution.
A possible reason for inconsistencies in factor structure of the ASI might be associated with its small number of items. Majority of its 16 items are related to Physical Concerns whereas few items assess Cognitive and Social concerns. In addition, some of them do not target any specific domain. For example, it is ambiguous which factor is related with the item: "It is important for me to stay in control of my emotions".
It was in an endeavor to find a solution with the problems in the ASI that the Anxiety Sensitivity Index-Revised (ASI-R)23 was developed to more comprehensively measure the lower-order domains of AS. However, the subsequent researches did not reveal consistent factor solutions with the ASI-R.14,24 Also, there have not been found optimal factor structures of the Korean version of Anxiety Sensitivity Index-Revised (K-ASI-R).25
Based on the existing research findings, it was first necessary to devise an AS scale with stable factor structure across different cultures, nations, and languages. Taylor et al.26 developed the ASI-3 which consists of 18 items and assesses the 3 factors most commonly replicated in previous studies: Physical, Social, and Cognitive Concerns. Factor structure of the ASI-3 was bolstered by confirmatory factor analyses with diverse samples, including a clinical sample from the United States and Canada and non-clinical samples from the United States, Canada, France, Mexico, the Netherlands, and Spain. However, in their study Asian sample was not included. Thus, the validity of the ASI-3 remains to be examined in Asian samples.
The aims of this study are 1) to evaluate the factorial validity of the Korean version of the ASI-3 (K-ASI-3), 2) to evaluate the concurrent validity of the K-ASI-3, 3) to evaluate the role of the Social Concern subscale of the K-ASI-3 in predicting life satisfaction and worry, 4) to evaluate the internal consistency of the K-ASI-3, 5) to examine if Koreans express more Social Concerns than their European-American counterparts.
Though it is necessary to investigate samples with clinically significant AS, researches using non-clinical samples are also requisite. The appropriateness of and need for using non-clinical samples when studying AS is bolstered by study indicating that AS has a dimensional latent structure.27 In addition, it has also been suggested that non-clinical samples may prove optimal when examining AS because "psychiatric populations have high rates of co-existing disorders and primary care samples may have an over-representation of patients with disease conviction"28 (p. 541) and data from nonclinical samples may be needed to identify individuals who may be theoretically at risk for developing anxiety-related disorders. Thus, use of a non-clinical sample in the current study is in agreement with the existing AS literature and seems to be a suitable plan for studying the usefulness of the ASI-3.
METHODS
Participants
Participants consisted of 761 college students recruited from introductory psychology courses at two Universities in Seoul. All of the participants were between 17 and 32 years of age (Mean age=21.43 years, SD=2.59). 55% of the participants were female. No data are reported on the clinical background of these participants.
356 of the 761 college students participated in the exploratory factor analysis. The participants were between 18 to 30 years of age, and 67% of them were female (Mean age=21.50 years, SD=2.29). Of 761 participants, 264 college students participated in the confirmatory factor analysis. The participants were between 18 to 42 years of age (Mean age=22.97 years, SD=3.01). Approximately 70% of them were female. Participants consisted of 142 college students recruited for investigating the concurrent validity and testing the role of the Social Concerns subscale of the K-ASI-3 in predicting life satisfaction and worry. We hypothesized that Social Concerns subscale would explain more variance of life satisfaction and worry than the other subscales of the K-ASI-3. All of the participants were between 17 and 22 years of age (Mean age=18.29 years, SD=0.81). 35% of the participants were female.
Measures
The Korean version of the Anxiety Sensitivity Index-3 (K-ASI-3)
Items were selected out of the pool of 36 K-ASI-R29 items according to findings with Taylor et al.'s study.26 The selected items of the K-ASI-R were 4, 6, 7, 13, 15, 16, 17, 18, 19, 24, 26, 27, 31, 32, 33, 34, 35, and 36. The respondents indicated their level of agreement with each item on a scale ranging from 'very little' (coded as 0) to 'very much' (coded as 4). Linguistic equivalence of the K-ASI-R was evaluated using a standard forward-backward translation procedure.25,29
The Korean version of the Satisfaction with the Life Scale (K-SWLS)
The satisfaction with life scale (SWLS), developed by Diener et al.30 is a widely used measure of subjective well-being. Diener et al.30 define life satisfaction as a conscious cognitive judgment of life in which individuals compare their life circumstances to a self-imposed standard. Each of the items is rated from 'strongly disagree' (coded as 1) to 'strongly agree' (coded as 7). The internal consistency coefficient of the K-SWLS is 0.77.31
The Korean version of the Center for Epidemiologic Studies-Depression Scale (K-CES-D)
The Center for Epidemiologic Studies-Depression Scale (CES-D)32 is a 20-item measure of depressive experiences comprising 16 negative items (e.g., I felt sad) and four positive items (e.g., I felt happy). All questions refer to mood and attributions over the past week. Symptoms are rated on a four-point scale ranging from zero to three indicating the symptom occurred "Rarely or none of the time (0)", "Some or a little of the time (1)", "Occasionally or a moderate amount of the time (2)", or "Most or all of the time (3)".
The Korean version of the Penn State Worry Questionnaire (K-PSWQ)
The Penn State Worry Questionnaire (PSWQ) is a 16-item questionnaire that assesses excessive and uncontrollable worry.33 Each of the items is rated from 'not at all typical of me' (coded as 1) to 'very typical of me' (coded as 5). After reverse scoring five items, a total score is computed by summation (i.e., range of scores is 16 to 80 with higher scores reflecting higher levels of worry). The internal consistency coefficient of K-PSWQ is 0.92, and the test-retest reliability is r=0.90 for a 4-week period.34
The Korean version of the Brief Fear of Negative Evaluation Scale-Brief (K-BFNE)
The Brief Fear of Negative Evaluation Scale35 is a 12-item questionnaire that assesses fear of negative evaluation, the core feature of social phobia. Each of the items is rated from 'not at all...characteristic of me' (coded as 1) to 'extremely...characteristic of me' (coded as 5). The internal consistency coefficient of K-BFNE is 0.89.36
Procedure
Informed consent was obtained first, and then students completed the battery in a classroom setting, during class time. Researchers were available during questionnaire completion to answer any questions. The questionnaires took approximately 20 minutes to complete via pen and pencil.
Data analyses
Prior to analysis, data were examined for departures from normality. The Kolomogorov-Smirnov Test was applied to examine the skewness and kurtosis of the distribution. Since data departed from normal distribution (e.g., for the K-ASI-3 item 10, skewness=3.05 and kurtosis=10.02), and consequently, the latent variable analyses were performed using robust maximum likelihood (MLM) in Mplus 2.02.37
To explore the relationship between the K-ASI-3 subscales and the other variables, we used Spearman ρ correlations. Given the number of correlations being tested, p values were set at 0.006 to control for experiment-wise error (the Bonferroni approach to multiple significance tests was utilized, so an initial alpha of 0.05 was divided by the number of measures or 0.05/8). To determine the internal consistency reliability of the K-ASI-3 total scale and subscales, we used Cronbach's alpha, with thresholds of alpha at or above 0.70.38
RESULTS
Exploratory factor analysis
Three subscales of the original ASI-3 are moderately correlated with each other. Therefore an oblique (promax) rotation was used. The number of factors to retain was evaluated using (1) Kaiser's eigenvalue greater than 1 factor extraction rule,39 (2) examination of the scree plot,40 (3) the interpretability of the resulting factor structures,41 and (4) model fit indices. We also used Thurstone's (1947) criteria,42 which include (a) a minimum number of items with salient loadings (≥0.30) on more than one factor, (b) a minimum number of items that do not have salient loadings on any factor, and (c) each factor is well-defined (i.e., has three or more salient loadings per factor). The goodness of fit of the EFA models was confirmed by the Root Mean Square Error of Approximation (RMSEA) and the Root Mean Square Residual (RMR).Values of RMSEA of less than 0.08 and RMR of less than 0.05 imply an acceptable model fit.43
Four factors possessed eigenvalues greater than one (6.00, 1.95, 1.79, 1.01). From the scree analysis, we estimated that one to three factors were necessary to explain the data, but the one- and two-factor models were obviously not enough to explain the data fully (Table 1). An acceptable model fit was obtained for a three-factor solution [χ2(102)=211.615, RMSEA=0.055, RMR=0.041] and a four-factor solution [χ2(87)=134.755, RMSEA=0.039, RMR=0.033]. However, Thurstone's criteria and Gorsuch's criterion indicated that the three-factor solution had the most optimal structure.

Goodness-of-fit indices for the K-ASI-3 models: Exploratory Factor Analysis
Table 2 shows the rotated factor loadings for the final solution. The three-factor solution had: (a) a small number of complex items (zero items with salient loadings on more than one factor); (b) a small number of hyperplane items (zero items with no salient loading on any factor); and (c) a relatively high number of salient loadings per factor (i.e., factor I had 6, factor II had 6, and factor III had 6). Taking salient loadings as those ≥0.30, factor I pertains to Physical Concerns; factor II pertains to Social Concerns; factor III pertains to Cognitive Concerns.

Promax rotated loadings (3 factor model: students sample)*
Confirmatory factor analysis
CFA was performed to investigate the construct validity of the K-ASI-3 in a Korean student sample. Based on the EFA results, our hypothetical factor model contained three latent factors labeled Physical, Cognitive, and Social Concerns. The goodness of fit of the CFA models was evaluated using the Root Mean Square Error of Approximation (RMSEA),44 the Tucker-Lewis Index (TLI),45 the Comparative Fit Index (CFI),46 and the Root Mean Square Residual (RMR). To demonstrate good fit, the chi-square statistic for our measurement model normalized by degrees of freedom (χ2/df) should not exceed 3.0. Also, the values of CFI and TLI should be 0.90 or higher whereas the values of RMSEA and RMR should not exceed 0.08 and 0.05, respectively.43
The analysis examined the three-factor model of the K-ASI-3. An acceptable model fit was obtained for a three-factor solution [χ2(132)=215.430, TLI=0.932, CFI=0.941, RMSEA=0.049]. Further, both the standardized residuals and the modification indices suggested that no significant improvement to the structure could be proposed. Thus, the CFA finding cross-validated the three-factor structure suggested in the EFA.
Concurrent validity
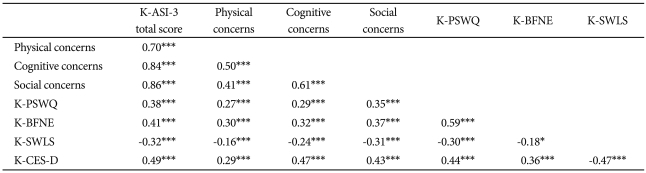
In order to examine the relationship between the K-ASI-3 domains and the other variables, Spearman's correlations were assessed (Table 3). Since some of the measures were not normally distributed (e.g., for the Cognitive Concerns, skewness=2.38 and kurtosis=8.18, for the Physical Concerns, skewness=1.97 and kurtosis=4.20, for the CES-D, skewness=1.39 and kurtosis=2.44), the correlation analyses were carried out using Spearman's correlations.
Zero-correlations among the study measures for study participants (N=142)
Table 3 presents correlations between the K-ASI-3, the lower-order K-ASI-3 factors, and the K-PSWQ, the K-SWLS, the K-BFNE, and the K-CES-D. The ASI-3 lower-order factors were strongly correlated with ASI-3 total scores (range=0.71 to 0.86). The three K-ASI-3 factors were moderately correlated (range=0.50-0.61). K-ASI-3 total scores were moderately correlated with measures of depression, worry, life satisfaction, and negative evaluation sensitivity (range=0.32 to 0.49). Consistent with theoretical expectations, the K-ASI-3 Social Concerns factor was more strongly associated with negative evaluation sensitivity (K-BFNE) than the other factors, while the K-ASI-3 Cognitive Concerns factor was more related to depression (K-CES-D) than the other factors. Social Concerns was consistently more associated with criterion measures than Physical Concerns. This was particularly the case with respect to life satisfaction, as Social Concerns was correlated with the K-SWLS at ρ=-0.31 compared to a correlation of -0.16 for Physical Concerns.
Regression analyses
Regression analyses were conducted to test the role of the Social Concerns subscale of the K-ASI-3 in predicting life satisfaction and worry. We hypothesized that Social Concerns subscale would explain more variance of life satisfaction and worry than the other subscales of the K-ASI-3.
Separate hierarchical regression analyses were conducted, predicting scores on the K-PSWQ and the K-SWLS. During each analysis, Social Concerns was entered in the second step, and Physical Concerns and Cognitive Concerns were added in the third step. We also conducted regression analyses with the order of entry of the K-ASI-3 factors reversed.
Social Concerns was entered in the second step of the regression equation predicting the K-PSWQ and was significant, t(133)=4.78, p<0.001. Physical Concerns and Cognitive Concerns did not account for significant additional variance in the K-PSWQ, beyond that accounted for by Social Concerns, when it was entered on the third step, t(131)=-0.45, p=0.64, t(131)=1.88, p=0.06, respectively, and Social Concerns was still significant, t(131)=3.50, p<0.01 (Table 4).

Summary of regression analysis for variables predicting K-PSWQ (N=142)
Cognitive Concerns domain was entered in the second step of the regression equation predicting the K-PSWQ and was significant, t(132)=3.04, p<0.01. Physical Concerns dimension was also entered in the second step of the regression equation predicting the K-PSWQ and was insignificant, t(132)=0.19, p=0.84. Social Concerns accounted for significant additional variance in the K-PSWQ, beyond that accounted for by Physical Concerns and Cognitive Concerns, when it was entered on the third step, t(131)=3.50, p<0.05, and Cognitive Concerns was no longer significant, t(131)=1.88, p=0.06 (Table 4). In the final model, Physical, Social, and Cognitive Concerns accounted for 17.3% of the variance in the K-PSWQ, F(4, 131)=6.84, p<0.001 (Table 4).
Social Concerns was entered in the second step of the regression equation predicting the K-SWLS and was significant, t(134)=-3.21, p<0.01. Physical Concerns and Cognitive Concerns did not account for significant additional variance in the K-SWLS, beyond that accounted for by Social Concerns, when it was entered on the third step, t(131)=-0.42, p=0.67, t(131)=-1.11, p=0.26, respectively, and Social Concerns was still significant, t(131)=-2.12, p<0.05 (Table 5).

Summary of regression analysis for variables predicting K-SWLS (N=142)
Cognitive and Physical Concerns were entered in the second step of the regression equation predicting the K-SWLS and was insignificant, t(133)=-1.87, p=0.06, t(133)=-0.82, p=0.41, respectively. Social Concerns accounted for significant additional variance in the K-SWLS, beyond that accounted for by Physical Concerns and Cognitive Concerns, when it was entered on the third step, t(132)=-2.12, p<0.05. In the final model, Physical, Social, and Cognitive Concerns accounted for 12.6% of the variance in the K-SWLS, F(4, 131)=6.84, p<0.01 (Table 5).
Reliability and item-level analyses
Internal consistency tests gave a Cronbach's alpha of 0.87 for the global scale, with an alpha of 0.73 (6 items) for the Physical Concerns subscale, 0.83 (6 items) for the Social Concerns factor, and 0.86 (6 items) for the Cognitive Concerns domain. All factors exceeded the 0.70 level considered as an acceptable internal consistency. Item-total correlations ranged from 0.37 to 0.63 for the Physical Concerns subscale, from 0.41 to 0.70 for the Social Concerns factor, from 0.54 to 0.72 for the Cognitive Concerns domain, and from 0.25 to 0.64 on the entire scale (Table 6).
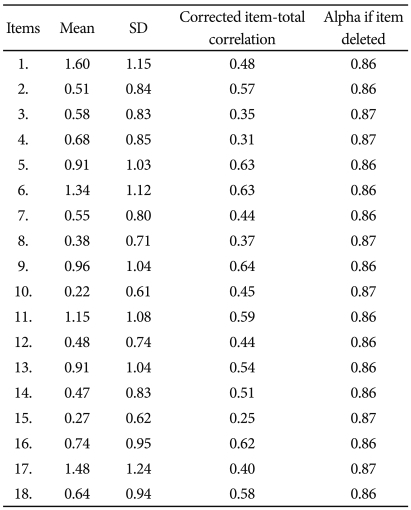
Mean, standard deviation, correlation of each K-ASI-3 item with the sum of the other items and internal consistency if the item is deleted
Sample characteristics and group differences
Effect size differences were calculated to examine if Korean college students express more Social Concerns than their U.S. counterparts. The U.S. male sample47 was similar to Korean sample in age (mean=18.9 years, SD=1.28), and the U.S. female sample was also comparable to Korean sample in age (mean=18.75 years, SD=1.22). Expected group differences were not observed (Table 7).

DISCUSSION
The present study represents the first evaluation of the psychometric properties and the latent structure of the Asian (Korean) translation of the ASI-3. Results from our EFA and CFA displayed that a three-factor solution provided a suitable fit for the present data. Consistencies in the factor structure are shown between the current study and the Taylor et al.'s study.26 The K-ASI-3 was found to consist of three lower-order factors as same as the Taylor et al.'s result.26 Also, each domain of the K-ASI-3 has the same items as the Taylor et al.'s study.26
The correlations between the K-ASI-3 and other self-report measures were examined. Scores on the total K-ASI-3 were moderately correlated with measures of depression, worry, life satisfaction, and negative evaluation sensitivity. In addition, the K-ASI-3 Social Concerns factor was more strongly associated with negative evaluation sensitivity than the other factors, while the ASI-3 Cognitive Concerns factor was more related to depression than the other dimensions.
We found the Social Concerns factor is most strongly related to life satisfaction and worry. However, contrary to the expectation, the current findings displayed that the Social Concerns domain scores of the Korean college students were not higher than those of the European American college students. These results are not in line with the previous findings that East Asians generally endorse greater social anxiety than do Westerners and that social anxiety is related to AS48-50 because of the fear of being negatively evaluated when displaying observable symptoms of anxiety. We can speculate the reason why the Social Concerns domain scores of the Korean college students were equal to those of the European American counterparts. It is true that East Asians generally endorse greater social anxiety than do Westerners, but estimated effect sizes range widely from d=0.25 to 1.10 according to the measures of social phobia. Also, independent self-construal accounted for the ethnic differences in social anxiety ratings.10 If there are not significant relationships between Social Concerns and independent self-construal, we cannot expect the cultural differences in Social Concerns.
The present study has several important limitations. First, the study was conducted with university students. Therefore, we should be cautious about generalizing these findings to other samples, and they should be replicated with a more representative sample from the general population. Second, only self-reporting data was included, and thus relationships between study variables may have been inflated by questionnaire-specific method variance. Third, the results of this study can be potentially applicable to Koreans residing in the metropolitan area in Korea. The study area should include the other regions in Korea in order to get a more comprehensive picture of the general population. Lastly, socioeconomic status was not evaluated, thus it is possible that variability in our results may be caused by SES differences.
This research suggests that the K-ASI-3 appears to be a promising measure of AS. The K-ASI-3 was determined to be composed of highly internally consistent and psychometrically sound items. It seems to reliably measure three lower-order domains assessing Physical, Social, and Cognitive Concerns. Future studies with this scale could give a more comprehensive picture of the role of AS in the development and maintenance of mood, anxiety, and substance-related disorders in Korea.