Development of Random Forest Algorithm Based Prediction Model of Alzheimer’s Disease Using Neurodegeneration Pattern
Article information

Abstract
Objective
Alzheimer’s disease (AD) is the most common type of dementia and the prevalence rapidly increased as the elderly population increased worldwide. In the contemporary model of AD, it is regarded as a disease continuum involving preclinical stage to severe dementia. For accurate diagnosis and disease monitoring, objective index reflecting structural change of brain is needed to correctly assess a patient’s severity of neurodegeneration independent from the patient’s clinical symptoms. The main aim of this paper is to develop a random forest (RF) algorithm-based prediction model of AD using structural magnetic resonance imaging (MRI).
Methods
We evaluated diagnostic accuracy and performance of our RF based prediction model using newly developed brain segmentation method compared with the Freesurfer’s which is a commonly used segmentation software.
Results
Our RF model showed high diagnostic accuracy for differentiating healthy controls from AD and mild cognitive impairment (MCI) using structural MRI, patient characteristics, and cognitive function (HC vs. AD 93.5%, AUC 0.99; HC vs. MCI 80.8%, AUC 0.88). Moreover, segmentation processing time of our algorithm (<5 minutes) was much shorter than of Freesurfer’s (6–8 hours).
Conclusion
Our RF model might be an effective automatic brain segmentation tool which can be easily applied in real clinical practice.
INTRODUCTION
Dementia is a clinical syndrome characterized by chronic and progressive cognitive decline, behavior disturbance, and loss of daily functioning [1]. The prevalence of dementia increased rapidly with the rise of aging population. Globally, around 50 million people have dementia, and nearly 10 million new cases are confirmed every year. More than 70 causes of dementia are known, and Alzheimer’s disease (AD) is the most common type of dementia accounting more for than 50–70% of all cases [2].
AD can be definitively diagnosed only after death, by linking clinical measures with histopathological evidence of amyloid plaques and hyperphosphorylated tau tangles in postmortem brain [3]. Thus, diagnosis of AD still resides primarily on clinical decision, which is based on evaluating a patient’s cognitive dysfunction, behavior and psychological symptom, and functional impairment [4]. However, studies showed that deposition of cerebral β-amyloid (Aβ), hyperphosphorylation of tau protein, and neurodegeneration of cerebral cortex begin decades before the onset of clinical symptoms of dementia [5]. Recent advance in diagnostic technologies have enabled us to assess or measure such AD pathologies using in vivo biomarkers, which could play an important role as diagnostic tools of AD by corresponding with post-mortem histopathological findings [6]. In these regards, the National Institute of Aging and Alzheimer’s Disease Association (NIA-AA) recently proposed a newer biomarker-based definition of AD and staging of the disease labeled as ATN system [7]. For a more accurate characterization of AD trajectory, the ATN staging system is designed with quantification of three core biomarkers including Aβ deposition (A), pathologic tau (T), and neurodegeneration (N). Since, cerebral accumulation of pathologic proteins may result in neurodegenerative change before clinical symptom presentations, several neurodegeneration biomarkers using structural MRI such as lowered hippocampal formation and medial temporal lobe volume, and decreased cortical thickness are increasingly suggested to be effective in classifying patient with AD trajectory [7-11]. In addition, recent development of neuroimaging initiatives, which contain larger number of databases freely accessible to researchers and clinicians, enabled the development of and urged for the application of automated whole brain degenerative pattern recognition for early detection of AD [12].
Machine learning (ML) is a technique which is useful in recognizing and extracting meaningful patterns from medical images [13]. Previous ML studies using structural MRI showed that it can efficiently classify subjects within AD continuum including cognitive normal adults, mild cognitive impairment (MCI), and AD [14-19]. Previous ML studies in neuroimaging data mostly relied on a single classifier such as support vector machine and linear discriminant analysis [20,21]. However, recently developed ensemble ML algorithms such as Random Forest (RF) showed better performance than single ML classifier algorithms in diagnosis of various neurological diseases [22]. In addition, RF is known to have additional advantages when compared to other ML methods [23]. First, it has less risk of overfitting. Second, it is considered to be more stable even in the presence of outliers and in the very high dimensional parameter spaces. An intrinsic feature selection step, which gives important values to each feature to reduce the variables space, is another important characteristic of RF [22,23]. Previous studies using structural MRI from the Alzheimer’s Disease Neuroimaging Initiative (ADNI) database showed that ML with RF model showed mean accuracies for the binary classifications of AD vs. healthy controls (HC) and MCI vs. HC were 90.3% and 81.3%, respectively [22,24]. However, the structural images used in the study were collected from 1.5T MRI machine. Thus, replication of RF algorithm to a more variety of structural images acquired from 3T MRI is needed to improve its diagnostic validity and test-retest reliability. Lastly, most of the previous studies used brain segmentation algorithm from the Freesurfer program which requires 6–10 hours per subject. This long segmentation time hindered application of RF based classifying algorithm for AD to real clinical settings [23].
In this study, we first developed a fast processing automated segmentation method based on deep learning algorithm and then compared accuracy of our segmentation results with that of the segmentation done using Freesurfer in subjects with AD, MCI, and HC. In addition, we compared diagnostic accuracy of RF based classification model of AD using our newly developed brain segmentation methods with that of Freesurfer’s.
METHODS
Subjects
A total 647 subjects (AD=100, MCI=86, and NC=461) were included in this study. They were recruited from volunteers of the Catholic Aging Brain Imaging (CABI) database, which holds brain MRI scans of outpatients at the Catholic Brain Health Center, Yeouido St Mary’s Hospital, the Catholic University of Korea from 2017 to 2019. Each participant provided written informed consent. Study procedures were approved by an Institutional Review Board (IRB Number: SC18RNDI0070) of Yeouido St Mary’s Hospital, the Catholic University of Korea. The inclusion criteria of the NC group were as follows: 1) subjects aged ≥60 years; 2) Mini-Mental Status Examination score ≥27; and 3) Overall clinical Dementia Rating score=0. Following subjects meeting Petersen’s criteria of MCI were included: 1) objective cognitive impairment for age, education, and gender; 2) memory complaint, preferably provided by an informant; 3) essentially conserved general cognitive function; 4) largely intact activities of daily living; and 5) not demented [25]. All MCI patients had an overall CDR score of 0.5. Objective cognitive impairment was defined as a performance score of 1.5 standard deviation (SD) below the each age-, educationand gender-specific normative means in at least one of the nine cognitive tests included in the Korean version of Consortium to Establish a Registry for Alzheimer’s disease (CERAD-K) neuropsychological battery [26]. In addition, the inclusion criteria of the AD group were as follows: 1) subjects aged ≥60 years; 2) the National Institute of Neurological and Communication Disorders and Stroke/Alzheimer Disease and Related Disorders Association (NINCDS-ADRDA) diagnosis of probable AD; and 3) overall CDR score of more than 1.0 [7]. Subjects with any neurological, psychiatric and unstable medical conditions were excluded. Table 1 shows the baseline demographic data for the three groups.

Demographic and clinical characteristics of the study participants
Sub-sampling
Number of subjects included among three groups (NC: 461, MCI: 86, AD: 100) were not equally balanced. Thus, when performing 3-fold cross validation, among the data number of binary classes to classify the validation set, we first divided the group containing the smallest sample size by 3 (and the number of samples for the comparison groups was matched accordingly [i.e for MCI: 86 vs. AD: 100; 86/3=rounded up to 28 yielding MCI (28) vs. AD (28), HC (29) vs. MCI (29), and HC (33) vs. AD (33)].
MR image acquisition
Imaging data were collected at the Department of Radiology, Yeouido St Mary’s Hospital, The Catholic University of Korea, using a 3T Siemens MAGETOM Skyra machine and eight channel Siemens head coil (Siemens Medical Solutions, Erlangen, Germany). The parameters used for the T1-weighted volumetric magnetization-prepared rapid gradient echo scan sequences were TE=2.6 ms, TR=1,940 ms, inversion time=979 ms, FOV=230 mm, matrix=256×256, and voxel size=1.0×1.0×1.0 mm3.
Preprocessing and features extraction
T1-weighted MRIs were processed for an automated classification of HC, MCI and AD. MRIs were preprocessed by the Freesurfer (version 6) and U-Net++ deep learning-based segmentation processing [27]. We used the Freesurfer and our deep learning method for extracting numerical data into a table format (Figure 1). The detailed algorithm for our deep learning-based segmentation methods are described in the supplemental materials. The set of 106 layer sub-volume-based features used for the training procedure are also described in the Table 2.
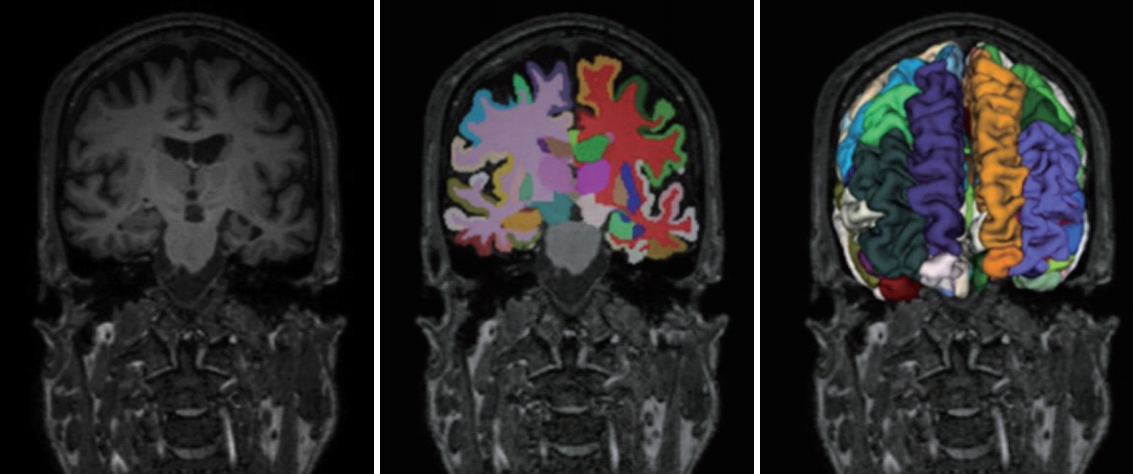
106-layer brain segmentation results.
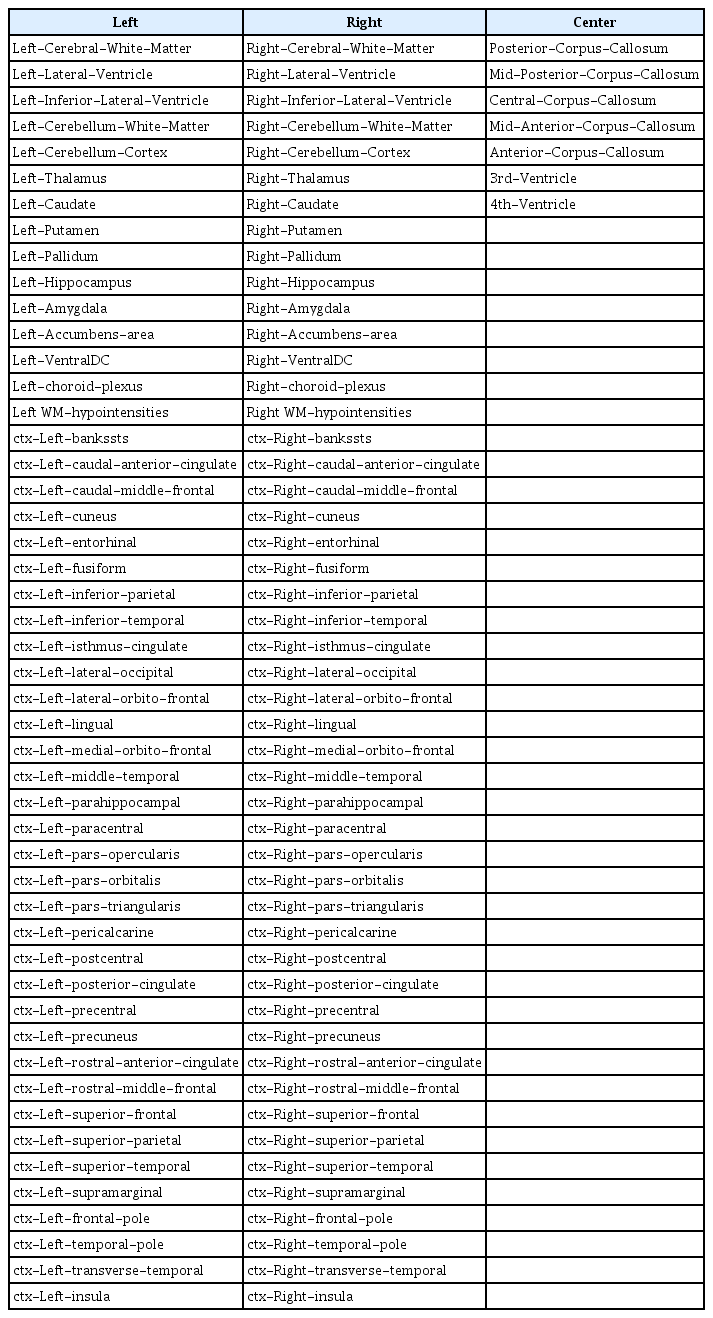
Summary of brain sub-volumes
Problem formulation
Our classification model was based on the RF method and its operational capabilities. In terms of the model, we performed feature importance using the Gini impurity index, which is a type of feature importance measurement mainly used in RF. The background information of the concerned methodologies and description of each classification model that we employed are described in detail elsewhere [22,28].
Random forest
RF is a popular machine learning approach used in regression,classification and other tasks [28]. The method involves construction of the decision trees, and randomness is utilized in the following ways (Figure 2). First, respective decision tree is built using a different bootstrap sample. Second, during the building of respective decision tree, node split involves the random selection of a subset of variables based on which the best split is determined and used. For the prediction of unknown cases, the decisions of the constructed trees are aggregated by utilizing majority voting for classification and averaging for regression tasks. Operational feature of RF is its natural ability to supply a ranking of the importance of variables in a regression or classification task. This can be achieved in two ways. The first one is based on statistical permutation tests, while the second, which is used in this study, is based on Gini impurity index. The Gini impurity is calculated at all node split during the building of a decision tree in an RF model and is employed for measuring the quality of the split in terms of dividing the samples of the different classes in the considered node. For a variable, the Gini impurity index is calculated as in the following equation:

A flowchart that describes the RF classifier mode. MCI: mild cognitive impairment.
Where the node n is 1 minus the sum over all the classes J (for a binary classification task this is two) of the fraction of examples in each class pi squared. For a given node split, the values of the Gini impurity index for the two resulting nodes are less than the value for the parent node. If we sum the Gini impurity decreases for 3 each variable in a dataset over all trees in a RF model, we get the corresponding Gini importance value for each variable, which be used for the feature selection as a result.
Modes description
In terms of the features of the classification model, it involved the training of a RF classifier on the whole feature set, as well as feature selection by means of the Gini importance measure, which provided the final feature subset that was utilized for retraining the RF model. Finally, for the prediction of unknown data based on the outputs of the RF model. In the case of ties, the class with the highest probability estimate was selected as the final prediction. RF model is developed using the Random-ForestClassifier of Python-based scikit-learn library package [29].
RESULTS
Baseline demographic and clinical data
Table 1 shows the baseline demographic data for the three groups. All variables were normally distributed. There were no significant differences in age, gender and education among the groups other than the neuropsychological data.
Performance of the classification
With regard to the RF parameters that we utilized, the number of trees for each RF model was set empirically, while for each RF model and for each node split during the growing of a tree, the number k of the subset of variables used to decide the best split was set based on repeated 3 fold cross-validation that was performed using the Python package [29]. Thus, the following parameter values were used for the RF model.
RF Model: Number of trees=1,000, k=3
Regarding the threshold values for the Gini importance measure during the feature selection task in the RF model, the following values were used: 0.5 for RF Model. We evaluated the following step; HC vs. MCI, HC vs. A, DMCI vs. AD
We used two types of features (with the use of the Gini importance measure) for RF model. One included cortical and subcortical volume information and basic patient characteristics including age and gender (sub-features), while another included cognitive functioning in addition to cerebral volume information and basic patient characteristics (all-features). The performance of binary classification is shown in Table 3.
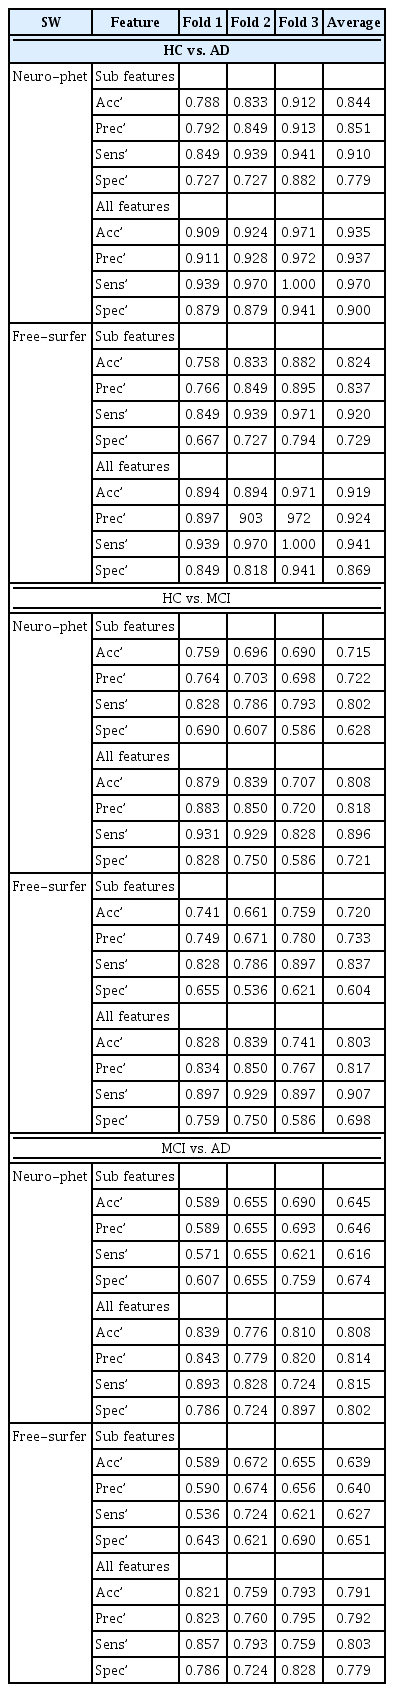
The performance of binary classification
The performance for diagnosis prediction is shown in Table 3 and Figure 3. The matrix summarizes a total of 180 test samples in the cross-validation set with fold-3. Our segmentation method showed average accuracy for predicting diagnoses of HC vs. MCI was 71.5% (AUC=0.81) in sub-features is and 80.8% (AUC=0.88) in all-features, for diagnoses of HC vs. AD the accuracy was 84.4% (AUC=0.92) in sub-features and 93.5% (AUC=0.99) in all-features, and for diagnoses of MCI vs. AD the accuracy was 64.5% (AUC=0.71) in sub-features and 80.8% (AUC=0.88) in all-features. Diagnostic accuracy using Freeusurfer for HC vs. MCI diagnoses was 72.0% (AUC=0.81) in sub-features and 80.3% (AUC=0.89) in all-features, for HC vs. AD it was 82.4% (AUC=0.911) in sub features, and for MCI vs. AD it was 63.9% (AUC=0.70) in sub-features and 79.1% (AUC=0.87) in all-features. The classifier identified HC vs. AD diagnoses accurately, but relatively higher inaccuracy was noted for MCI versus AD diagnoses. Thus, the AUC value is calculated to micro-average for 3 cross validation set. Figure 4 shows the confusion matrix of third fold validation set (maximum accuracy).
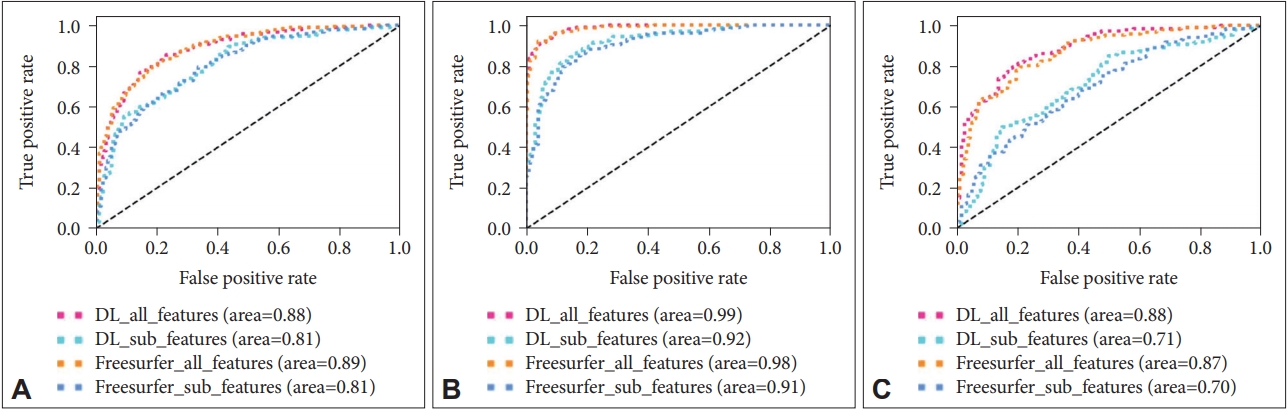
A: HC vs MCI. B: HC vs AD. C: MCI vs AD. HC: healthy controls, MCI: mild cognitive impairment, AD: Alzheimer’s disease.

The confusion matrix of third fold validation set. DL: deep learning-based segmentation, FreeSurfer: FreeSurfer-based segmentation, All features: sub-volume, patient and cognitive test feature information, Sub features: patient information and sub-volume feature information extracted from deep learning-based segmentation method.
Feature importance
In the feature importance, the feature values of the cognitive test were ranked high for all-features. In terms of the features of cortical and subcortical volume information, inferior lateral ventricle, lateral ventricle, hippocampus, amygdala, lingual, inferior parietal, fusiform were ranked high. The performance of feature importance is shown in Figure 5.
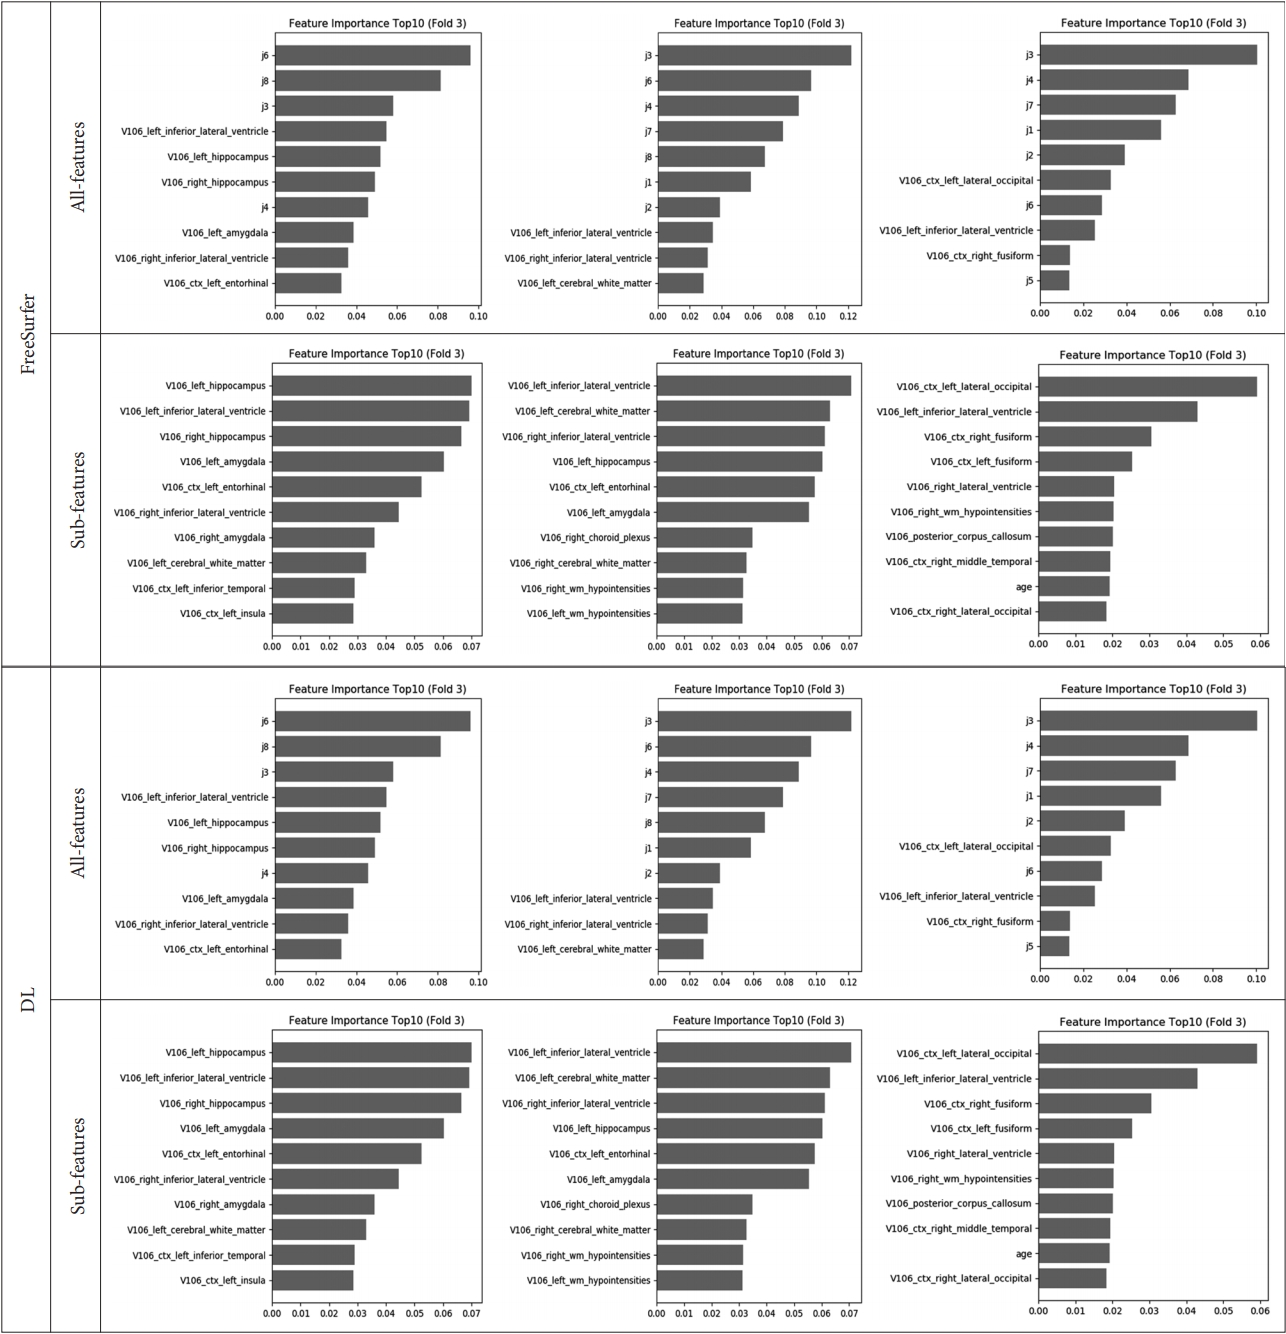
Feature importance of third fold validation set. Left side is HC vs. MCI, Center is HC vs. AD, and right side is MCI vs. AD. All features: sub-volume, patient and cognitive test feature information, Sub features: patient information and sub-volume feature information extracted from deep learning-based segmentation method, HC: healthy controls, MCI: mild cognitive impairment, AD: Alzheimer’s disease.
DISCUSSION
In the contemporary model of AD, it is regarded as a disease continuum involving preclinical stage to severe dementia rather than as disease with three or four distinct entities [7,30,31]. Thus, quantification index which could reflect structural change of brain in a continuous measurement is needed to correctly assess a patient’s severity of neurodegeneration. Cortical volume or thickness measurement of structural MRI has been commonly used as an objective indicator of disease progression in AD research [32-34]. In terms of technological evolution, automatic segmentation methods such as Freesurfer and Statistical Parametric Mapping (SPM) became widely available. However, the role of automatic segmentation-based diagnosis assisting algorithms in clinical practice was limited because such automatic segmentation methods required a long processing time. Low inter-method reproducibility was another important limitation hindering previous methods to be widely applied in clinical practice [35].
In this study, we developed a quick cerebral cortical and subcortical volume analysis method using deep learning-based algorithm. We also evaluated newly developed algorithm’s segmentation performance by comparing it with segmentation conducted with Freesurfer. Compared with Freesurfer, segmentation processing time of our algorithm was much shorter (less than 5 minutes for our method and around 6–8 hours for Freesurfer). Despite much faster time for segmentation, there was a high correlation between our methods and Freesurfer’s with the average Dice coefficients of 106 labelling area of 0.840±0.083 (Supplementary Materials in the online-only Data Supplement). Thus, our method might be an effective automatic brain segmentation tool which can be easily applied in real clinical practice.
ML can identify distinctive images and clinical features, which is considered as a promising technique for differential diagnosis of AD [15]. Thus, increasing studies in the field of neuroimaging have focused on the use of advanced ML algorithm in assisting differential diagnosis among patients with AD, MCI, and normal cognition [16,18,23,36-38]. However, besides longer process time and low inter-method reproducibility, low reliability of previous ML models was another important limitation. To fill in this important gap, we developed a more advanced RF model for prediction of AD which primarily used cortical and subcortical volumes as important predictive factors and also used additional information by combining cognitive function and patient characteristics. This model showed stable performance in testing process and acceptable accuracy for prediction of AD. Besides being faster than Freesurfer, our model also showed high accuracy in differentiating HC from AD with 93.5% (AUC 0.99), which was higher than that of the previous model which used Freesurfer 91.9% (AUC 0.98). In addition, the accuracy of our model for differentiating MCI from HC and MCI from AD were 80.8% and 80.8%, respectively, which was similar to a previous RF model showing accuracy of 81.3% (AUC) in differentiating MCI from HC using the cortical thickness and subcortical volumes and MMSE total scores [24]. In another study, accuracy of differentiating MCI from AD was in ML mode was 60–90% [17]. In line with previous researches, the accuracy was higher in differentiating AD from HC than in differentiating MCI from HC or MCI from AD [17,24]. MCI is an intermediate stage between the expected cognitive decline of normal aging or HC and the more serious decline of dementia, so patients with MCI inevitably contains overlapping clinical and neurodegenerative features with both AD and HC [39]. Thus, both our and previous model had a more difficulty in classifying this grey area, MCI, than more distinctive stage including AD and HC. Nevertheless, the accuracy of our RF model for differentiating MCI from HC or MCI from AD was a relatively higher than that of previous literature reporting 60–90% [18,38,40,41]. Moreover, the diagnostic accuracy of our RF model was higher when the model used all-features including cortical and subcortical cortical volume, patient characteristics, and cognitive information rather than using sub-features which did not include cognitive function. Thus, both multi parameters and our RF model have contributed to the improvement in accuracy [34].
The feature importance of our RF model for differentiating HC from AD was similar with previously known cortical atrophy patterns of AD, such as inferior lateral ventricle (temporal horn of lateral ventricle), hippocampus, and amygdala, but some regions were such as cerebral white matter, fusiform gyrus, insular cortex were considered important only in our model [42]. The difference could be due to the RF model itself or different patient characteristics, and further studies containing larger sample size are needed to clarify this issue. Additional issues should also be resolved before a computer-based brain imaging diagnostics or ML-based diagnostics can be readily applied in clinical practice. First, the stable diagnosis results should be produced despite variety of the images were collected from different MRI scanner, magnetic field strength and image resolution, and pulse sequence. Second, reliable results should be provided under various ages, gender, and race. Therefore, more studies containing diverse age, sex, and race collected from diverse MRI scanners including classical 1.5T MRI and more recent 3T MRIs are needed to enhance clinically utility of automatic segmentation-based diagnosis assisting algorithms.
There are several limitations in this study. First, our study only involved single center data with small sample size. Second, we did not have pathological diagnosis and amyloid PET for inclusion of AD subjects, although we carefully included patients with probable AD and possible AD based on the NINCDS-ADRDA Alzheimer’s Criteria [2,42]. Third, we used only cortical and subcortical volume features from structural MRI and did not include other important MRI modalities reflecting white matter hyperintensity or cerebral bleeding.
Our results had relatively lower accuracy for MCI vs. AD. A larger dataset is required for the study to improve the corresponding measures’ accuracy on those specific populations of interests; the inclusion of larger pool into the segmentation development cycle may help to improve segmentation performance. We attempted to address the above-mentioned lower accuracy issue, we incorporated demographic information, cognitive test results, and specific ROI volumes into our model. We expect a better performance of MCI vs. AD diagnosis with advanced imaging techniques, such as deep learningbased methods utilizing multi-modal imaging features and feature fusion in the future.
In conclusion, we showed that our RF model showed acceptable clinical feasibility and accuracy for differentiating HC from MCI and AD using structural MRI, patient information and cognitive function. This RF model not only may help clinicians to predict patients with AD continuum but may also aid to recognize patient having higher risk of AD in routine clinical practices.
Supplementary Materials
The online-only Data Supplement is available with this article at https://doi.org/10.30773/pi.2020.0304.
Acknowledgements
This work was supported by the National Research Foundation of Korea (NRF) grant funded by the Korea goverment (MSIT) (No.2019R1A2C2009100), Research and Business Development Program through the Korea Institute for Advancement of Technology (KIAT) funded by the Ministry of Trade, Industry and Energy (MOTIE) (grant number: P0009507) and the “HPC Support” Project, supported by the Ministry of Science and ICT and National IT Industry Promotion Agency (NIPA).
Notes
The authors have no potential conflicts of interest to disclose.
Authors’ contribution
Conceptualization: Hyun Kook Lim, JeeYoung Kim, Donghyeon Kim. Data curation: Min Kyoung Lee, Sheng-Min Wang, Nak-Young Kim, Dong Woo Kang, Yoo Hyun Um, Hae-Ran Na, Young Sup Woo, Chang Uk Lee, Won-Myong Bahk. Formal analysis: JeeYoung Kim, Minho Lee. Funding acquisition: Donghyeon Kim, Hyun Kook Lim. Investigation: JeeYonng Kim, Minho Lee, Min Kyoung Lee. Methodology: Minho Lee, Donghyeon Kim. Project administration: Donghyeon Kim, Hyun Kook Lim. Resources: Donghyeon Kim, Hyun Kook Lim. Software: Minho Lee. Supervision: Donghyeon Kim, Hyun Kook Lim, Sheng-Min Wang. Validation: Minho Lee. Visualization: Minho Lee. Writing—original draft: JeeYoung Kim, Minho Lee, Donghyeon Kim, Hyun Kook Lim. Writing—review & editing: JeeYoung Kim, Minho Lee, Sheng-Min Wang, Donghyeon Kim, Hyun Kook Lim.