Long-Term Evolution of Metabolic Status in Patients with Schizophrenia Stably Maintained on Second-Generation Antipsychotics
Article information
Abstract
Objective
Second-generation antipsychotics (SGAs) increase the risk of metabolic syndrome (MetS). Despite the risk of MetS, SGAs may have to be continued with change in some patients. The aim of this study was to trace the evolution of MetS in these patients.
Methods
Patients with schizophrenia who had been maintained on a fixed SGA regimen for more than a year were followed-up without changing the regimen. Metabolic indicators were evaluated at baseline and at follow-up. Prevalence, incidence and spontaneous normalization rate of MetS were estimated. Risk factors that might have influenced the evolution were scrutinized.
Results
A total of 151 subjects were included. During the mean observation period of 389.9±162.4 days, the prevalence of MetS was increased from 35.1 to 45.0%. The incidence rate was 29.6%, while the normalization rate was 26.4%, risk factors affecting incidence were age (OR=1.09, 95% CI: 1.03–1.17), baseline continuous values of metabolic syndrome risk scores (cMetS, OR=1.77, 95% CI:1.29–2.55) and baseline body weight (OR=1.06, 95% CI: 1.01–1.13). Normalization was influenced by age (OR=0.74, 95% CI: 0.57–0.89) and baseline body weight (OR=0.85, 95% CI: 0.72–0.95).
Conclusion
The prevalence of MetS steadily increased with the continuous use of SGAs. However, individual difference was extensive and about a quarter of the patients were able to recover naturally without specific measurements.
INTRODUCTION
Mortality rate in schizophrenia patients is significantly higher than in general population [1]. The mortality gap has widened over the previous three decades and the introduction of second-generation antipsychotics (SGAs) is suspected of being responsible [1,2]. Despite the increasing concern over these adverse effects, SGAs have become established as the mainstream thearpy [3-5].
The concept of metabolic syndrome (MetS) has been introduced for the purpose of early detection and active management [6]. Individuals with MetS are twice as likely to develop cardiovascular disorder (CVD) and three times more likely to develop diabetes mellitus (DM) [7]. Monitoring MetS provides an opportunity to identify high-risk populations and to prevent the progression to morbidity and mortality [8]. Against this backdrop, MetS has gained more attention as the subject of active studies.
There is extensive literature on the prevalence of MetS in the context of SGA use. In a meta-analysis, the overall rate of MetS was estimated to be 32.5% [9]. The prevalence in Korean patients was reported to be 31.7% in patients receiving aripiprazole, olanzapine or risperidone, and 46.0% in those receiving clozapine [10,11]. Meanwhile, incidence studies are relatively few in number [12-16]. These incidence studies tracked the drugnaïve or first episode patients for variable lengths of time after the initiation of drug treatment [12,16,17]. This design may provide information on the treatment-emergent adverse effects in the early phase of treatment. However, the obtained findings may not be applicable to long-term effects of SGAs. Investigation of the continuing burden of MetS in later maintenance phase is also needed to make critical decisions regarding drug switch or discontinuation [18].
In many cases, switching or discontinuation is not feasible and clinicians may have to persist the same medication in spite of the recognition of MetS. Little is known on what will happen to these occasions. Effect of SGAs in maintenance treatment phase may be different from that in acute treatment phase. For example, clozapine was not worse than other antipsychotics in terms of the long-term metabolic effects [19]. Therefore, data from chronic patients persisted on the same SGA regimen for a long time would be invaluable. To our knowledge, only two studies have satisfied this qualification [20,21]. These studies were unique in that newly developed cases (incidence cases) as well as normalized cases were explored. They demonstrated that the natural course of MetS is highly dynamic with the potential to normalize [21].
In order to predict the outcome, knowledge of risk factors would be helpful. Previous studies confirmed that higher risk of MetS was associated with the number of episodes, age and duration of illness [22-24]. The kind of medication used is also relevant [25]. In some studies, earlier changes of metabolic indicators were presumed to predict later long-term changes [26,27]. But, these studies focused only on incidence cases. Discovery of factors that aid or impede normalization from MetS may also be valuable. For example, baseline waist circumference predicts a lower chance of normalization [20].
Our study is similar in aim and scope to the study by Schorr et al. [20] A group of schizophrenia patients stabilized on their SGA medication were followed-up about one year. We measured the various metabolic indicators at baseline and at follow-up. The data were compared to trace the evolution of the MetS status and those of MetS components. Furthermore, baseline characteristics were inspected concerning their longer-term predictive utility.
METHODS
Participants
The Institutional Review Board approved all the procedures described in this retrospective cohort study (IRB No. H-0811-026-261). We reviewed the medical records of all patients who visited the schizophrenia clinic at a university affiliated hospital from June 2007 to October 2010. Only the patients whose diagnosis had been confirmed by Diagnostic and Statistical Manual of Mental Disorders, Fourth Edition (DSMIV-TR) were selected for further screening. The following inclusion criteria was used: 1) metabolic status measured more than twice, which were at least 6 months apart; 2) use of antipsychotics continuously for more than one year and with no regiment change for at least 3 months prior to the baseline; 3) baseline medication regimen unchanged until the followup measurement, except for dosage adjustment; and 4) absence of antihypertensive, antidiabetic or lipid-lowering agent use during the follow-up period. Metabolic data included fasting blood glucose (FBS), triglyceride (TG), high-density lipoprotein (HDL), waist circumference (WC), systolic blood pressure (sBP), diastolic blood pressure (dBP), body mass index (BMI) and body weight. Demographic and several clinical characteristics were also collected from medical records review.
Application of MetS criteria defined by NCEP ATP-IIIA
MetS was defined by applying the National Cholesterol Education Program Adult Treatment Panel III’s definition of MetS (NCEP ATP-IIIA) [28] and the Korean Society for the Study of Obesity (KOSSO) WC criterion [29]. The NCEP ATP-IIIA defines the presence of MetS as three or more of the following criteria: FBS level equal to or greater than 100 mg/dL; TG equal to or greater than 150 mg/dL; HDL-cholesterol level less than 40 mg/dL in males and 50 mg/dL in females; sBP equal to or greater than 130 mm Hg, dBP equal to or greater than 85 mm Hg; and WC equal to or greater than 90 cm for males or 85 cm for females [28,29].
The prevalence of MetS was estimated according to the number of subjects satisfying the criteria for MetS at baseline. The incidence cases was defined to be the newly found cases of MetS at follow-up among the subjects without MetS at baseline, and the normalization of MetS to be the disappearance of MetS at follow-up among the subjects with MetS at baseline [20].
cMetS
Continuous values of metabolic syndrome risk scores (cMetS) is a composite score modeling the association between potential risk factors and MetS. cMetS was computed using the standardized residuals (Z-score) of mean arterial pressure (MAP), TG, FBS, WC, and HDL following a previously published formula [30]. MAP was calculated as described before: MAP=[(sBPdBP)/3+dBP] [31]. Age and gender effects were controlled by regression using the data in the Fourth Korean National Health and Nutrition Examination Survey (KNHANES, 2007) [32]. Because the standardized HDL-cholesterol is inversely related to metabolic risk, it was multiplied by -1. Summation of obtained standardized residuals of metabolic indicators produced cMetS value. Higher cMetS indicated a more unfavorable MetS profile.
Statistical analyses
Demographic and clinical characteristics are summarized as mean±standard deviation and by frequency tabulation. These values were compared between males and females using Student’s t-test and chi-square test. To examine the time-dependent changes of the continuous-valued metabolic indicators, linear mixed-effect models were built for each metabolic indicator as a response variable. The length of the observation period was included as time covariate. Metabolic indicator variables were standardized to enable mutual comparisons. From the mixed-effects models, fixed-effect coefficients for time and for time-by-covariate interactions were inspected. The former coefficients reflect the degree and significance of the annual changes, while the latter indicate the covariates’ modifying effect on the annual changes.
The dichotomized metabolic indicators were used for calculating prevalence, incidence and normalization rates. They were also used for logistic regression analysis to inspect the influence of the covariates on the probability of endorsing each component criterion of NCEP ATP-IIIA. Finally, the whole patient group was divided into two subgroups according to the baseline MetS status. We performed separate logistic regression analysis for these subgroups with the MetS status at the follow-up as the response variable. In this way, we tried to examine the influence of the covariates on the probabilities of incidence and normalization. Demographic and clinical characteristics, as well as the continuous-valued metabolic indicators at baseline were included as the covariates. Since there were many covariates, regression of all possible subsets was done and the most optimal model with the smallest Akaike’s information criteria value was chosen. The statistical significance for all the analyses was set at 0.05. All statistical analyses were performed using R software version 3.2.4 (R Foundation for Statistical Computing, Vienna, Austria).
RESULTS
Demographic and clinical characteristics
There were 151 subjects with complete follow-up data (Table 1). There were no significant difference between sexes, except for chlorpromazine (CPZ) equivalent dose, which was significantly higher in male [477.7±203.0 vs. 400.6±205.5, T(149)=-2.29, p=0.023]. The mean observation period was about one year (389.9±162.4 days). Most of the subjects were in their middle thirties (mean age: 34.8±8.8). The mean duration of illness (DOI) was 11.8±6.5 years and the mean duration of treatment (DOT) was 10.6±6.3 years. No significant mean differences could be found between sexes for observation period, age, DOI or DOT. The mean chlorpromazine equivalent doses of medication were 445±207 mg/day at baseline and 449±214 mg/day at the follow-up point in time. Based on the baseline status, the type of current medication regimen was classified as clozapine monotherapy (n=54, 35.8%), clozapine+another single antipsychotic combination therapy (n=39, 25.8%) and other antipsychotic monotherapy (n=58, 38.4%). The first and second group were aggregated to form the clozapine used group (n=93, 61.6%) and the third group formed the clozapine not-used group (n=58, 38.4%).

Demographic and clinical characteristics of the subjects
Administered antipsychotics other than clozapine were amisulpride (n=4), aripiprazole (n=35), olanzapine (n=22), risperidone (n=29), and risperidone consta (n=7). The medication regimen at baseline had been started 3.0±3.6 years before the study initiation.
Change of various metabolic indicators over time
The result demonstrated that only cMetS, WC and dBP increased significantly during the follow-up period (Table 2). The annual change was expressed as the percentage change of the baseline value. They were 23% for cMetS, 1.6% for WC and 2.0% for dBP. The detailed analyses did not reveal any significant time-by-covariate interaction, meaning that the slopes for the change were not altered by any of the studied covariates.
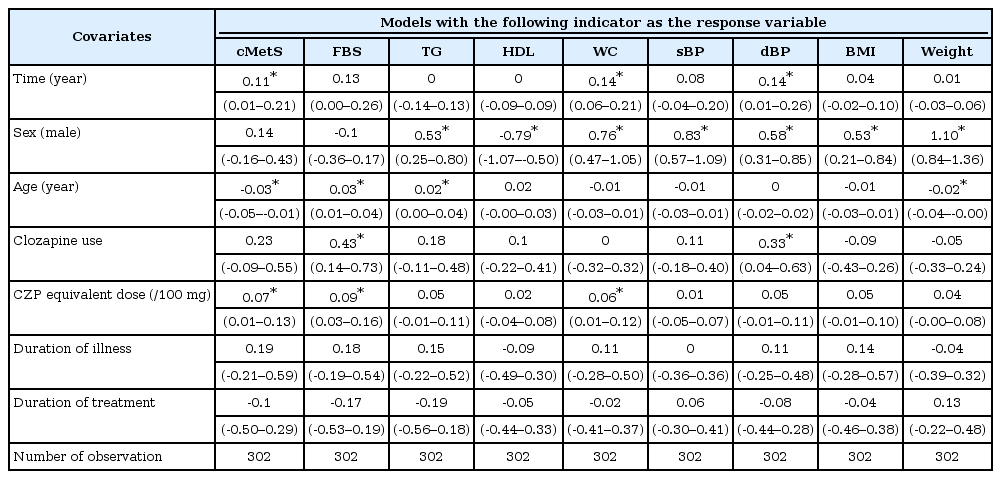
Summary of the linear mixed-effect models with each metabolic indicator as a response variable (row header)
The influences of time-invariant covariates on the mean values of the metabolic indicators were discernible with sex, age and clozapine usage (Table 2, Figure 1). Male subjects scored worse for the majority of the observed indicators (higher for TG, WC, sBP, dBP, BMI, and weight, but lower for HDL). Older age was associated with elevated FBS and TG, but was associated with lowered cMetS and weight. Subjects who received clozapine (as monotherapy or as combination therapy) scored higher for FBS and dBP. Duration of illness and duration of treatment had no influence on any of the measured metabolic indicators. Higher CPZ equivalent dose was linked with higher mean values of cMetS, FBS, and WC.
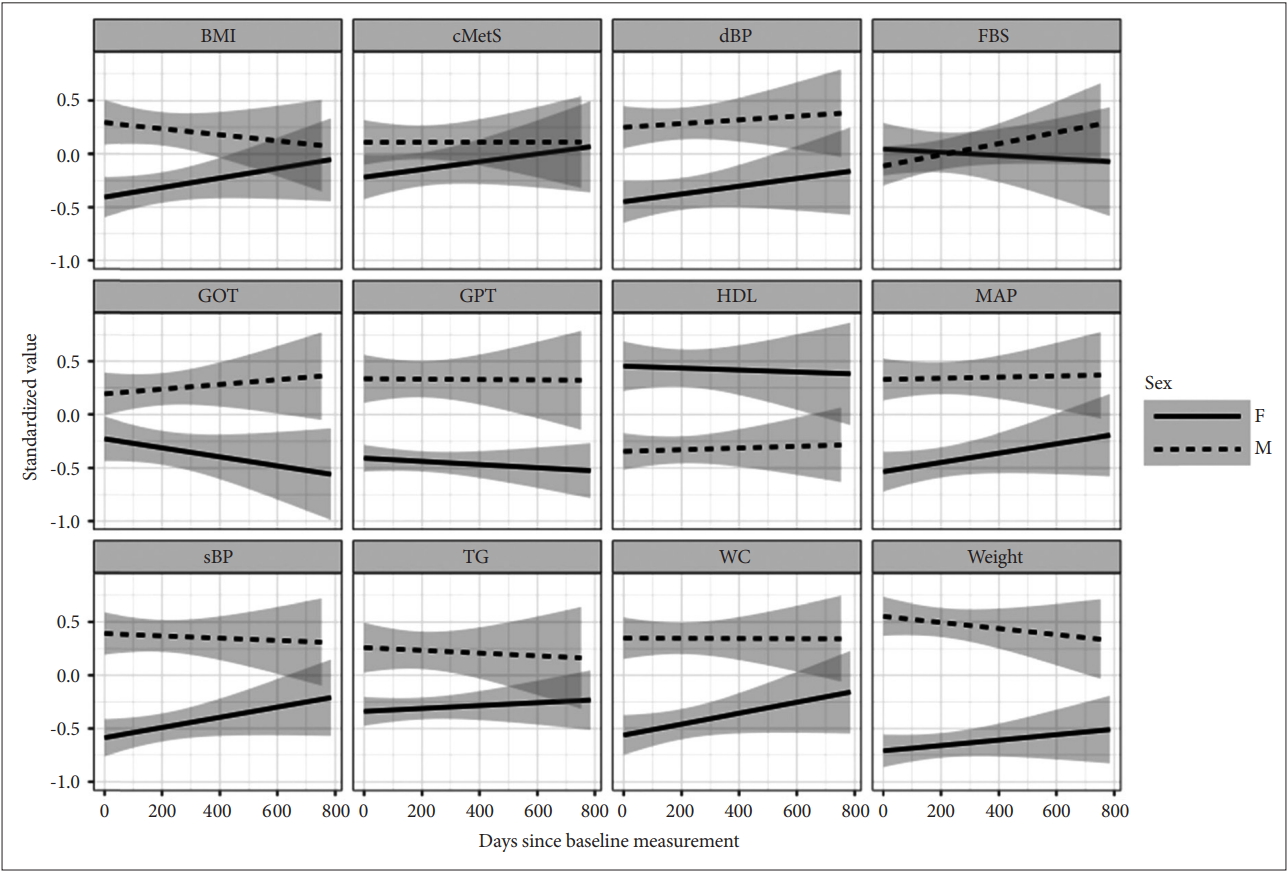
The sex-associated changes of various metabolic indicators over time during the follow-up period. The depicted lines were the conditional mean lines smoothed by linear mixed-effect regression. Gray areas were 95% confidence intervals. cMetS: continuous values of metabolic syndrome risk scores, FBS: fasting blood sugar, TG: triglycerides, HDL: high density lipoprotein, WC: waist circumference, sBP: systolic blood pressure, dBP: diastolic blood pressure, BMI: basal metabolic index, F: female, M: male.
Predictors for presence of MetS and endorsement of baseline component criteria at baseline
At baseline, 53 (35.1%) subjects met the NCEP ATP-IIIA criteria and were classified as MetS (+). Logistic regression analysis with the presence of MetS at baseline as the response variable demonstrated that male [Odds ratio (OR): 3.24, 95% confidence interval (CI): 1.51–7.29, p=0.003] and higher CPZ equivalent dose (OR: 1.21, 95% CI: 1.01–1.46, p=0.043) had significantly higher odds of satisfying NCEP ATP-IIIA criteria of metabolic syndrome (Table 3). Inspection of each component criteria revealed that age (OR: 1.09, 95% CI: 1.03–1.16, p=0.002), clozapine use (OR: 3.26, 95% CI: 1.39–8.25, p=0.009) and CPZ equivalent dose (OR: 1.43, 95% CI: 1.18–1.78, p=0.0005) raised the odds of satisfying FBS criteria.

The results of binary logistic regression analyses with the presence of metabolic syndrome and the endorsements of component criteria regressed on demographic/clinical characteristics
Incidence and normalization rates of metabolic syndrome
At the follow-up assessment, the percentage of MetS increased from 35.1% to 45.0% (Table 4). The endorsement rates of the component criteria generally increased during the follow-up period with the sole exception of TG: FBS (39.7–53.6%), HDL (29.8–35.1%), WC (43–52.3%), BP (32.5–40.4%) and TG (43.7–41.1%). The maximum net increase was obtained with FBS (35 new cases and 14 normalization cases). The incidence rate of MetS was 29.6% and the normalization rate was 26.4%. The incidence rates of component criteria ranged from 17.0% (HDL) to 38.5% (FBS), while the normalization rates ranged from 12.3% (WC) to 36.4% (TG). Overall, the normalization rates were comparable to the incidence rates except FBS (incidence 38.5% vs. normalization 23.3%) and WC (25.6% vs. 12.3%). In cases of TG and BP, the normalization rates were higher than incidence rates.
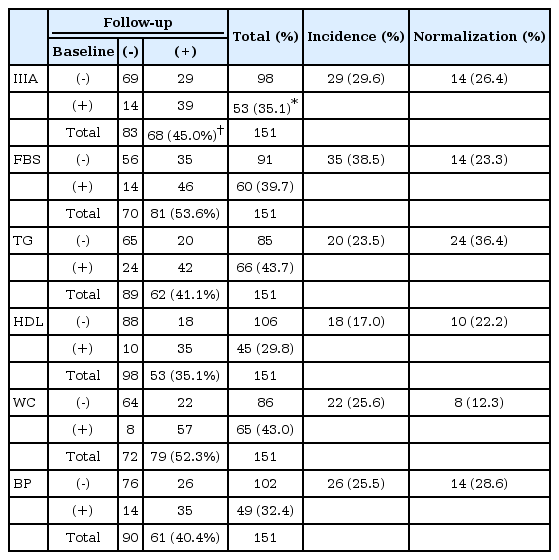
Two-by-two cross-tabulation of the number of NCEP ATP-IIIA defined metabolic syndrome and endorsements of component criteria 1) at baseline and 2) at follow-up evaluation
Predictors for the state conversion
In the incidence model, age (OR: 1.09, 95% CI: 1.03–1.17, p=0.009), baseline cMetS (OR: 1.77, 95% CI:1.29–2.55, p=0.0009) and baseline body weight (OR: 1.06, 95% CI: 1.01–1.13, p=0.031) were significant predictors of incidence probabilities. In the normalization model, age (OR: 0.74, 95% CI: 0.57–0.89, p=0.006), sex (OR: 5.10, 95% CI: 2.11–64.7, p=0.043) and baseline weight (OR: 0.85, 95% CI: 0.72–0.95, p=0.016) were significant predictor of normalization probabilities (Table 5). However, the extremely wide confidence interval associated with sex indicated the instability of the statistical model and prevented valid interpretation. Individuals with more advanced age and heavier weight had more risk of newly developing MetS and, simultaneously, less chance of recovery.

Summary of the binary logistic regression models with the NCEP ATI III defined metabolic syndrome (MetS) status at the follow-up as the response variable
DISCUSSION
In this study, we traced the long-term changes of metabolic status under the fixed SGA regimen in a group of chronic schizophrenia patients. During the follow-up period of 0.5 to 2 years, the prevalence of MetS increased from 35.1% to 45.0%. cMetS along with WC and dBP also increased significantly. Regression analysis confirmed that several demographic and clinical characteristics influenced some of these indicators regardless of time. However, efforts to find variables that could modify the time-dependent changes of metabolic indicators did not produce any meaningful results.
The results confirmed that the metabolic status gradually deteriorated under the fixed SGA regimen. This result is quite depressing in that SGAs’ adverse effects might have been progressive even in the later phase of treatment. The current findings coincide with the previous findings that age and duration of illness were associated with increased prevalence of MetS [9,24]. These evidences indicated the progressive worsening of metabolic profiles in patients on SGAs. However, it might also have been due to advancing age as in national general population.
However, inspection of the individual data suggests that potential for recovery was still appreciable. Although the incidence rate (29.6%) was higher than the normalization rate (26.4%), they were still of the same order of magnitude. The chance of recovery may give hope in the management of MetS. Situations abound in which a patient’s history does not permit medication switching despite an unfavorable medical condition [33,34]. In these situations, modifying lifestyle or trying a pharmaceutical intervention may be the only options [19]. Meanwhile, many researchers pointed out the limited impact of currently available measures [35,36]. Further research in this field is needed.
Logistic regression analysis revealed age and baseline body weight as predictors for both incidence and normalization probabilities. Patients with advanced age were doubly disadvantaged in that they were more likely to develop MetS and less likely to normalize [11]. This observation may not be remarkable since age is the main risk factor of MetS also in normal population. However, it simultaneously indicates that more close monitoring and rigorous measures should be undertaken in aging population of chronic schizophrenia. In contrast to the unalterable nature of age, body weight may be controlled with proper care and education. Body weight was revealed to be another predictor of normalization in our study. More obese subjects had more risk and less chance of recovery. Weight gain or fluctuation appears to precede the onset of other manifestation of MetS [37]. In their long-term follow-up study of clozapine-medicated patients, Bai et al. [38] observed that most metabolic parameters were related to initial weight gain. The importance of our finding lies in the fact that obesity may not only deepen the severity of MetS but may further reduce the chance of recovery. Therefore, any management strategies may have to include aggressive plans to control body weight [39,40]. Proper education and encouragement to exercise would be essential possibly with pharmacological interventions including antihypertensive, antidiabetic and lipid-lowering agent.
This study tried to investigate what would happen if the offending SGAs were persisted in spite of evidence of MetS. The possibility may include: 1) relentless worsening, 2) stabilization after the initial deterioration, and 3) fluctuation and instability. The most plausible hypothesis is that once MetS has settled down, further worsening is unavoidable. Many MetS patients eventually developed CVD and DM [8]. Incidence studies reported 15 to 30% of newly developed cases regardless of the stage of the disease [12,14-16]. The second hypothesis originated from the observation that the weight gain by SGA reached plateau after several months of treatment [41]. Furthermore, the increasing prevalence of MetS with age observed in general population tends to reach plateau around 50 to 60 years of age [42]. Whether similar plateau can be observed in antipsychotic-induced metabolic syndrome is not yet known [42]. The results in this study seem to support the first and third hypothesis. While the metabolic status of study subjects gradually deteriorated, it still demonstrated instability and the potential for recovery. These recovery cases may help to dispel an overly pessimistic view. The metabolic status of patients on long-term antipsychotic treatment may be highly dynamic and may change with time and with proper intervention [21].
This study had several significant limitations. The follow-up period of each subject was not uniform. We compensated this heterogeneity by including the length of follow-up as a covariate. However, the incidence or the normalization rate was not adjusted by the follow-up length. Secondly, since only the data from two measurements (baseline and the last follow-up) had been used, the status change during the interim period could not be observed. It is quite likely that the metabolic status kept fluctuating between the two measurements. Longitudinal observation with more frequent measurements would be needed in the future research. The third limitation is the abundance of clozapine-medicated patients. More than half of the included subjects (61.6%) had been on clozapine. These patients could not switch or discontinue the current medication because clozapine had been administered as the final option. Therefore, it is difficult to generalize this finding to the cases on other SGAs. Switching to more weight-neutral medications would always be the viable option if the patients’ clinical status permitted such measure. For example, separate analysis on aripiprazole using patients revealed that all the metabolic indicators except waist circumferences did not deteriorated any further. Incidence and normalization rate in aripiprazole-group were 38% and 36% respectively maintaining a near balance. A future study needs to use a larger cohort of subjects on diverse range of antipsychotics and to observe them with multiple regular-interval measurements. Such studies could potentially contribute to a better understanding of the dynamics of metabolic status on antipsychotic medications.
In summary, metabolic status gradually worsened, even in chronic patients with schizophrenia stably maintained on SGAs. However, the individual data revealed highly dynamic changes. About one-third of patients newly developed MetS and a comparable proportion of MetS subjects reverted to normal during about one year. The results highlight the importance of considering normalization phenomenon in understanding the dynamics of metabolic status. Remaining potential for recovery should not be ignored in chronic patients. In addition, age and body weight were important predictors of the incidence risk and normalization potential. Clinical management plans may have to consider these variables and include appropriate strategies.
Acknowledgements
This research was supported by the Institute of Clinical Psychopharmacology, Dongguk University College of Medicine.