Surface-Based Parameters of Brain Imaging in Male Patients with Alcohol Use Disorder
Article information
Abstract
Objective
The structural alteration of brain shown in patients with alcohol use disorder (AUD) can originate from both alcohol effects and genetic or developmental processes. We compared surface-based parameters of patients with AUD with healthy controls to prove the applicability of surface-based morphometry with head size correction and to determine the areas that were sensitive to brain alteration related to AUD.
Methods
Twenty-six abstinent male patients with AUD (alcohol group, mean abstinence=13.2 months) and twenty-eight age-matched healthy participants (control group) were recruited from an inpatient mental hospital and community. All participants underwent a 3T MRI scan. Surface-based parameters were determined by using FreeSurfer.
Results
Every surface-based parameter of the alcohol group was lower than the corresponding control group parameter. There were large group differences in the whole brain, grey and white matter volume, and the differences were more prominent after head size correction. Significant group differences were shown in cortical thicknesses in entire brain regions, especially in parietal, temporal and frontal areas. There were no significant group differences in surface areas, but group difference trends in surface areas of the frontal and parietal cortices were shown after head size correction.
Conclusion
Most of the surface-based parameters in alcohol group were altered because of incomplete recovery from chronic alcohol exposure and possibly genetic or developmental factors underlying the risk of AUD. Surface-based morphometry with controlling for head size is useful in comparing the volumetric parameters and the surface area to a lesser extent in alcohol-related brain alteration.
INTRODUCTION
Chronic and heavy alcohol drinking causes brain damage related to cognitive and behavioral problems shown in patients with alcohol dependence.1 Regarding brain structure, not only cerebral atrophy, such as widening of cerebral fissure or cerebrospinal fluid (CSF) spaces, but also volume changes in areas such as the gray and white matter, cerebellum, hippocampus, caudate, putamen, and nucleus accumbens have been observed and discussed in many reliable reports.23 However, there are mixed opinions about whether these structural alterations are the direct effects of alcohol use or the sort of endophenotype that increases the risk of alcohol-use disorders.4
Alcohol and its metabolite acetaldehyde act as neurotoxins, and problematic drinking causes significant brain damage via various mechanisms, such as reactive oxidative stress, mitochondrial damage, brain-derived neurotrophic factor alteration, and excitotoxicity related to the glutamate system.1 Another important cause of alcohol-related brain damage relates to thiamine deficiency, which can cause Wernicke-Korsakoff syndrome (WKS).5 Thiamine deficiency has been suggested as the cause of alcohol-related dementia (ARD), and many imaging studies support this assumption.6
Although white matter disease in chronic alcohol use was evident, gray matter damage was also shown.78 Cerebral gray matter is classified into cortical and subcortical gray matter. The development of computerized analytical programs makes it possible to estimate useful imaging parameters, such as cortical thickness.9 The use of cortical thickness in clinical imaging studies is increasing because cortical thickness relates to various clinical indices of not only normal aging10 and dementia11 but also major mental disorders, such as schizophrenia12 and bipolar disorder.13 This measure is associated with high reliability and sensitivity, and it has also been used with addictive disorders, such as alcohol dependence.7814
Cortical thickness is estimated by calculating the difference between the boundaries of gray and white matter resulting from surface-based analysis. We can also determine the cortical volume by using the product of thickness and surface areas in this analysis. These volumetric values of specific areas from surface-based analysis are the same as the values from traditional voxel-based morphometry.15
Unlike cortical thickness, surface area is generally not a significant parameter in many studies for various clinical populations, including alcohol dependence. Cortical surface area is mainly affected by the cortical folding pattern determined during brain development. Cortical gyrification is mostly unaffected by synaptic pruning and cortical aging and is an important in vivo marker for neurodevelopmental processes.16 Therefore, the size of the surface area is determined genetically or congenitally rather than by the effects of disease or toxins. If we could find the difference in surface areas between clinical groups and their control populations, it would be an innate endophenotype related to the risk of certain diseases or relapse, not a direct disease effect.
Comparing groups in a structural imaging study, we should consider the various parameters, such as age and gender. It is necessary to correct for head size, especially in a volume study. As neuroimaging techniques have developed, it has become possible to use automated values, such as estimated total intracranial volume (eTIV), for the head size. In contrast to volume studies, there are mixed opinions about whether it is necessary to correct for head size in thickness studies.171819 The thickness is distance as a one-dimensional value, and surface area is a two-dimensional value. The head-size correction is necessary in comparing group differences of the volume representing the product of surface area and thickness, but it is not clear how the head size acts on these two parameters separately. To ensure accuracy, we need to compare the brains of patients with alcohol dependence whose brain structure alteration has been established in previous research with controlled brains before and after controlling for head size.
We investigated the differences in brain structures of middle-aged male patients with alcohol dependence and age-matched healthy male controls based on similar backgrounds. Surface-based parameters, such as volume, thickness, and surface area of the alcohol-dependent patients' brains, were assessed using an automated program and compared with brains of the healthy controls. We tried to ascertain the significant parameters differentiating the clinical groups and compare the effect size of each parameter difference. At the same time, we conducted this study to verify the effect of head-size correction for comparing surface-based parameters between groups.
METHODS
Participants
Participants were enrolled male patients admitted to a mental hospital specializing in alcohol dependence in Cheongju, South Korea, from March 1, 2014, to August 31, 2014. Age-matched healthy male controls ranging from 40 to 65 years of age were recruited by advertisement. Diagnosis of alcohol dependence according to the Diagnostic and Statistical Manual, 4th edition (DSM-IV), was confirmed using structured interviews.20 All participants received ongoing treatment for AUD for a minimum of 3 months with complete abstinence. Their mean abstinence period was 13.2±16.1 months. Participants who had a major mental disorder, neurologic disease, severe systemic disease, or other substance use disorder, except nicotine and caffeine use disorder, were excluded from the study. Finally, 26 patients with alcohol dependence and 28 healthy male controls were selected for the study. The Bioethics Committee Board of Chungbuk National University approved all of this study's processes.
MRI acquisition
All magnetic resonance imaging (MRI) tests were collected on a 3T Philips Achieva scanner (Philips Medical System, Best, Netherlands) at the Ochang campus of the Korean Basic Science Institute. All participants were scanned with the same 32-channel head coil and the same pulse sequence. MRI T1 parameters were referenced from ADNI protocol [TR=6.8 ms, TE=3.1 ms, flip angle=9 degrees, 256×256 (1×1 mm) in-plane resolution, 170 1.2-mm slices without gaps].
Image processing
All images were processed using FreeSurfer (v. 5.3.0) with the default settings (http://surfer.nmr.mgh.harvard.edu) on a Mac Pro 64-bit OS X platform. The methods of surface-based analysis using FreeSurfer are described previously.21 In brief, a T1-weighted magnetization-prepared rapid gradient-echo (MPRAGE) scan was acquired from each participant and was aligned. Processing involved a surface-based method that calculated the distance between gray and white matter outlines after segmentation of gray matter, white matter, and cerebrospinal fluid (CSF) space. All images were aligned to a common surface template using a surface-based averaging technique that aligned cortical folding patterns.2223
Several manual quality-control measures and reprocessing were performed to increase reliability. Cortical thickness estimates were computed for lobar regions of interest (ROI) and point by point across the cortical surface. The lobar ROIs were derived from an automated labeling system that parcellated the cortical surface into 34 regions per hemisphere.2425 Mean thickness for each lobe was determined as the weighted average of each label in that lobe (frontal, parietal, temporal, occipital, cingulate, or insula) on the basis of the surface area of each label and combined across hemispheres, resulting in one value of thickness for each lobe per subject.26 Similarly, the sum of each lobar surface area in both hemispheres was used as the value of the surface area. At the same time, whole-brain cortical thickness was calculated using the weighted average of each label in each hemisphere, resulting in one value that represented the mean thickness of the entire cortical mantle per subject.
Controlling for head size
Estimated total intracranial volume (eTIV) was derived using the atlas scaling factor (ASF) method, producing an automated total intracranial volume estimate that was robust to brain atrophy and equivalent to a manually traced TIV.27
Head-size correction of structural parameters was derived using a procedure commonly described in the literature. Standardized structural values were calculated using the covariance approach.2728 Specifically, head-size-corrected brain parameters were estimated using the formula:
where SBPadj is the corrected value, SBPnat is the surface-based parameter in native space, and b is the slope of the parameter regression on eTIV. The mean eTIV is the sample mean of the eTIV.
Statistical analysis
Analyses were conducted using the R statistical package v. 2.15.3 as described in the website (http://r-project.org) with appropriate packages. Participant characteristics were examined using Student's t-test, Pearson correlation test, and nonparametric statistics where appropriate. The differences in surface-based parameters between groups were tested by Student's t-test, and the effect sizes of group differences were estimated using Cohen's d value.
RESULTS
Participants' characteristics
All 54 participants (26 alcohol group, 28 control group) were males ages 40–65. There were no differences in age distribution, education level, or socioeconomic status between groups. The mean weight of the control group was higher than that of the alcohol group (76.9±10.2 kg in control, 64.8±7.6 kg in alcohol group, chi-square=4.80, p<0.001). There were more divorced persons in the alcohol group (9/26 vs. 1/28, chi-square=17.5, p<0.01).
Volumetric parameters
There was no group difference in eTIV. However, there were significant group differences in total gray matter volume, total white matter volume, and whole brain volume. Those measures in the alcohol group were significantly lower than those of the control group. The group differences in volumes were robust after correcting for head size. The cortical gray matter volumes in whole, frontal, parietal, temporal, occipital, and insula brain of the alcohol group were significantly lower than those of the control group. These group differences were also robust after controlling for head size. The volumes of cerebellum, thalamus, caudate, putamen, hippocampus, amygdala, and accumbens in the alcohol group were significantly lower than those in the control group. These group differences were slightly increased after controlling for head size. The effect sizes of group differences in total gray matter (TGM) volume, total white matter volume (TWM), whole brain volume (WBV), and putamen were relatively large (Table 1).
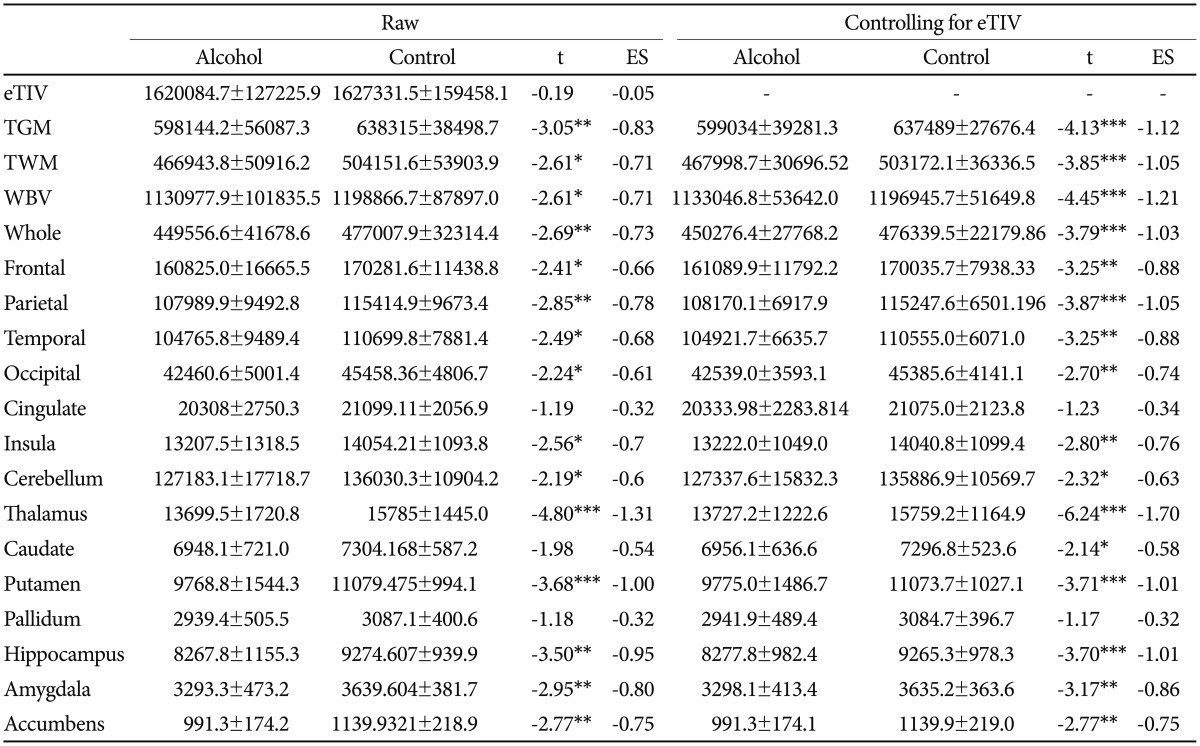
Group differences of volumetric parameters (mm3) before and after head size correction
Surface area and thickness
The cortical thicknesses of whole, frontal, parietal, temporal, occipital, and insula brain in the alcohol group were significantly lower than cortical thicknesses in those areas of the control group's brains. There was no group difference in thickness of cingulate. These patterns of differences were not affected by head-size correction. Effect sizes of group differences in the parietal and temporal lobes were relatively larger than those of the frontal, occipital, and insular lobes.
There were no group differences in surface areas in the whole brain and each lobe. However, some trends of group differences were shown in whole, frontal, and parietal brain after controlling for head size (Table 2).
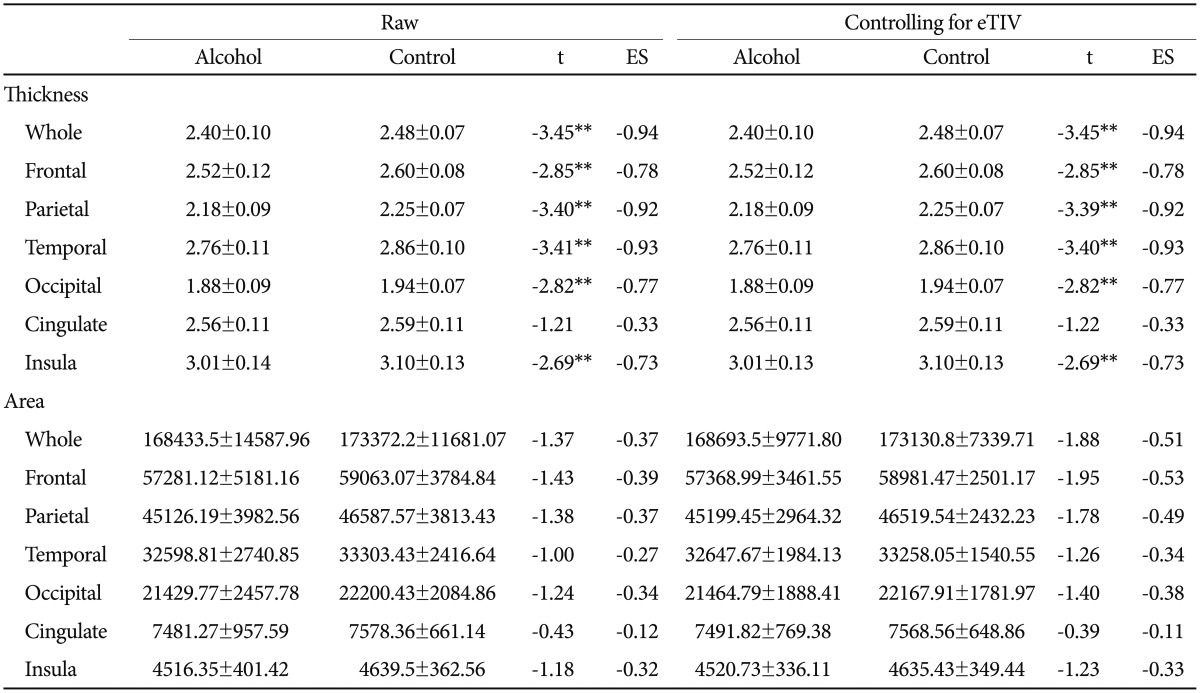
Group differences of cortical thicknesses (mm) and surface areas (mm2) before and after head size correction
DISCUSSION
We took brain magnetic resonance images to gather data for more than 25 middle-aged male patients with AUD and a similar number of age-matched healthy male controls who consumed alcohol at a social level, expecting significant group differences. We investigated imaging data, such as the volume of subcortical structures and 1-D thickness, 2-D area, and 3-D volume of cortical structures, systematically by using surface-based analysis to ascertain the pattern of group differences. Finally, we compared all data before and after controlling for head size to estimate the effect of head size on each surface-based parameter.
WBV, TGM, and TWM of patients with AUD were lower than those of healthy controls. The group differences were more significant after controlling for head size.
The group differences in TGM were more marked than the differences in TWM. Although there have been consistent reports about white-matter disease and decreased functional connectivity in AUD,2930 gray-matter change was more robust in our data.
Total gray matter consists of cortical and subcortical gray matter. Subcortical gray matter volume, measured by FreeSurfer, showed significant group differences. Thalamus and putamen showed the largest group differences, and hippocampus, amygdala, and accumbens showed moderate and significant group differences. All of these regions have been shown to be compromised in chronic alcoholics.3132 There are reports that subcortical volume decrement in these areas is not shown in long-term abstinent alcoholics (LTAA, mean abstinence=6.3 years), suggesting the recovery of subcortical volume with sustained abstinence in cases without psychiatric comorbidity.31 In this study, all participants were in an abstinence period of about 1 year; thus, they did not meet the criteria for LTAA. Additionally, we excluded subject volunteers with other psychiatric disorders from this study. Therefore, our finding that subcortical structures of short-term abstinent alcoholics (STAA) without psychiatric comorbidity were still not normalized is consistent with previous study reports.31 The differences in effect sizes of subcortical structures may originate from differences in structural size.
We found group differences in the volume of all cortical gray matter except cingulate. The volume of cortical gray matter was determined by the product of surface area and thickness (surface area×thickness) in surface-based analysis. There were significant group differences in cortical volume and thickness but not in surface area. Therefore, group differences in cortical volume mainly originated from group differences in cortical thickness.
Durazzo et al.7 reported significant thickness decrement in patients with AUD compared with healthy controls, and in those who relapsed within a 1-year follow-up period, further reduction of cortical thickness related to the brain reward system (BRS) and its top-down mechanism. Furthermore, they observed subtle differences in surface areas between relapsers and abstinent patients. They found group differences in total BRS surface area but not in each ROI area. These findings suggest that reduction of surface area in AUD indicates the endophenotype related to relapse or poor treatment outcome. Considering that the cortical gyrification that is closely related to surface area was determined genetically or developmentally before age two,16 the insignificant group differences in surface areas in this study suggest that there should be no group differences in genetic or developmental backgrounds. Considering the finding that predetermined lower surface areas, especially in specific regions, were related to AUD relapse risk, the surface area need not be different between AUD patients and healthy controls. We could not classify the relapser and the abstainer because of the short follow-up period. Further study is needed to determine the effect of surface area on the relapse risk of participants with AUD.
Our finding that the group differences of cortical thickness in the parietal and temporal lobes were more prominent than in the frontal and insula lobes differs from previous reports that thickness reduction was shown in the structure consisting of BRS.7 We discovered group differences in cortical thickness in areas not only limited to BRS, such as frontal or insula areas, but also in almost the entire cortical mantle, with differences being especially marked in the parietal and temporal areas.
With regard to cortical volume, group differences were more robust in the parietal lobe. Fein et al.33 reported that parietal gray matter volume loss related to cognitive impairments that are known to persist in spite of long-term abstinence, such as spatial processing deficit, could not completely recover through long-term abstinence. Therefore, the regional differences in volume changes shown in this study were concordant with their results and could originate from the differences of recovery rate from alcohol-induced brain shrinkage. The differences of structural change patterns among studies, including this study, may be affected by the demographic or clinical characteristics of the subjects. Our participants' characteristics were more in line with those in Fein et al.'s33 report that showed parietal volume reduction and associated spatial processing difficulty in middle-aged abstinent alcoholics.
Cortical volume is affected by cortical thickness and surface area independently.15 With regard to brain structure, however, cortical volume is affected more by surface area than by cortical thickness. The regional area is measured on the surface between adjacent landmarks, giving a higher quadratic weight to tangential (horizontal) than to vertical (radial) distances, explaining why volume is more related to area. In our data, regression analyses showed 70–80% of volume variances could be explained by surface area and the remaining 20–30% could be explained by cortical thickness. We could not observe significant group differences in surface area. Statistical trends, however, were shown only in frontal and parietal areas. Therefore, parietal area, which showed relatively large group differences in cortical volume and surface area, can be the most prominent area showing volume differences concordant with previous reports using voxel-based analysis.33
Furthermore, the decrement of gray matter density and volume located in the parietal and temporal lobes and some areas of the frontal lobes in boys with AUD were shown in another study.14 The authors argued that the gray matter structural alteration was not the result of alcohol effect per se. Our findings showed much more marked group differences in the same areas compared to those in other areas. We assume that the reduction of the areas in middle-aged males was due to both trait markers and alcohol effect. On this basis, we postulate that the marked reduction of parietal and temporal cortical thickness is due to incomplete normalization with short-term abstinence, plus structural alteration due to genetic or developmental causes.
Regarding volumetric structure, there were group differences in WBV, TGM, TWM, cortical volume, and the volume of subcortical structures, including structures consisting of BRS, and these differences were more prominent after controlling eTIV.
Although it is clear that head-size correction is necessary in volume studies, there were mixed results in controlling for head size in surface-based analysis. There was no change in comparing group differences in cortical thickness before and after head-size control with eTIV. Considering the lessened effect of cortical thickness on cortical volume, it is not meaningful to control for head size in a cortical thickness study. Meanwhile, the group differences trend in surface area developed after controlling for head size. Considering the close relationship between volume and surface area, it is reliable to control for head size when comparing the surface areas.
This study had several limitations. The first is the accuracy of the automated segmentation system. Segmentation using FreeSurfer showed good agreement with a semi-automated, supervised system such as the Center for Morphometric Analysis. Some discrepancies were found between these two methods in smaller regions of the brain, however, especially with male alcoholics.34 Therefore, we should consider this limitation in interpreting the results from FreeSurfer. It is, however, a good, clinically applicable tool to segment brain areas with minimal time and effort.
All participants in the alcohol group received different treatments, such as naltrexone, acamprosate medication, and cognitive-behavioral therapy, and we could not control for the treatment methods. We expect, however, that the effect of short-term medication on brain structure is limited. Furthermore, because the group was admitted to the same hospital within the same approximate time period, the treatment regimen was not varied. We could not compare imaging data with neurocognitive data. It remains a subject for further study. In addition, our data and a meaningful body of previous evidence support our conclusion, but it is still not fully proven. It will be necessary to follow up with each group with an expanded number of participants to prove our conclusions in this study.
Acknowledgments
This work was supported by the research grant of Chungbuk National University in 2013.