Distribution of Active and Resting Periods in the Motor Activity of Patients with Depression and Schizophrenia
Article information
Abstract
Objective
Alterations of activity are prominent features of the major functional psychiatric disorders. Motor activity patterns are characterized by bursts of activity separated by periods with inactivity. The purpose of the present study has been to analyze such active and inactive periods in patients with depression and schizophrenia.
Methods
Actigraph registrations for 12 days from 24 patients with schizophrenia, 23 with depression and 29 healthy controls.
Results
Patients with schizophrenia and depression have distinctly different profiles with regard to the characterization and distribution of active and inactive periods. The mean duration of active periods is lowest in the depressed patients, and the duration of inactive periods is highest in the patients with schizophrenia. For active periods the cumulative probability distribution, using lengths from 1 to 35 min, follows a straight line on a log-log plot, suggestive of a power law function, and a similar relationship is found for inactive periods, using lengths from 1 to 20 min. For both active and inactive periods the scaling exponent is higher in the depressed compared to the schizophrenic patients.
Conclusion
The present findings add to previously published results, with other mathematical methods, suggesting there are important differences in control systems regulating motor behavior in these two major groups of psychiatric disorders.
INTRODUCTION
Schizophrenia and major depressive disorders are both major health problems in all parts of the world,12 and are, in common with other functional psychiatric disorders, defined by their clinical features. Finding objective, biological, differences between these disorders could give important insights in relation to pathophysiology and classification. Electroencephalography is one commonly used method for this purpose,3 another is recording of motor activity. Alterations of motor activity are prominent features in several psychiatric disorders, such as ADHD,4 mood disorders and schizophrenia,56 with the most pronounced disturbances seen in the catatonia.7 In a number of studies of patients with psychiatric disorders objective registrations of motor activity have demonstrated differences in activity patterns compared to normal controls and between disorders.891011 However, assessment of such changes has only to a limited extent been implemented in routine clinical practice.
We have in previous studies, using actigraph registrations combined with mathematical analyses of variability and complexity, shown that patients with depressive disorders and schizophrenia differ in the organization of motor activity both over short and long time periods.56
It has been thought that the time intervals between behavioural events usually occur randomly, following an exponential distribution and thus giving a straight line on a log-linear plot (probability vs. waiting time), meaning that very long inter-event times should be very rare. There is now increasing evidence that many different types of human actions instead are characterized by bursts of activity separated by long periods with inactivity, examples of this being communication events, such as sending e-mails or making telephone calls.12 Such actions will follow a heavy-tail distribution, and on a log-log plot (probability vs. waiting time) this will appear as a straight line, suggestive of a power-law distribution.
With this as background, and using actigraphs to measure human activity, Nakamura et al.13 and Sano et al.14 have found that the distribution of active and inactive periods can be used to characterize the behavioural organization of patients with depression and schizophrenia, and that these distributions show differences compared to healthy controls. Furthermore, Nakamura et al.,15 found that the organization of motor activity of mice displayed a similar pattern, such that the cumulative distribution of resting period durations seemed to obey a power-law distribution, and they also found that mice lacking clock genes differed from normal mice.
The aims of the present study has been to use these methods to reanalyze our actigraph registrations of depressed and schizophrenic patients in order to see if we can 1) replicate the findings of Nakamura et al.13 and Sano et al.14 and 2) to look for possible correlations between these findings and the altered variability and complexity parameters found in short- and long-term recordings from the same patients.
METHODS
Ethics statement
The study protocol was approved by the Norwegian Regional Medical Research Ethics Committee West. Written informed consent was obtained from all participants involved in the study.
Subjects
The study group consisted of 24 psychotic patients (3 women and 21 men), all with a diagnosis of schizophrenia, from an open ward for long-term patients (Knappentunet in Bergen) and 23 patients with mood disorders (10 women and 13 men), all currently depressed, five inpatients from an open psychiatric ward and 18 outpatients, all from the Haukeland University Hospital in Bergen), reported on in two previous papers.56 The control group consisted of 18 women and 11 men, average age 37.8±13.3 years (mean±SD), range 21-66, medical students (n=5), patients without serious medical or psychiatric symptoms from a primary care office (n=4) and employees from Knappentunet (n=20). None of the control subjects had a history of affective or psychotic symptoms.
Psychiatric assessment
All diagnostic assessments of the depressed patients were performed by one of the authors (OBF) using used a semi-structured interview based on DSM-IV criteria16 for mood disorders. Depressive symptoms were assessed by the use of the Montgomery-Asberg Depression Rating Scale (MADRS).17
Diagnostic evaluations of the chronic psychotic patients were made by another of the authors (JØB) and a consensus diagnosis, based on DSM-IV criteria, was made after discussion of each case with OBF. Psychotic symptoms were evaluated by the use of the Brief Psychiatric Rating Scale (BPRS).18
The 23 depresssed patients fulfilled criteria for major depression according to DSM-IV. They had a mean age 42.8±11.0 years. Fifteen had a major depressive disorder, one a bipolar I disorder and 7 bipolar II disorder. Their mean MADRS score at the start and end of registration were 22.7±4.8 (range 13-29) and 20.0±4.7 (range 11-28), respectively.
The group of 24 patients with schizophrenia had mean age 47.4±11.1 years (range 27-69 years). Their mean age at first hospitalization was 24.4±9.3 years (range 10-52 years). Eighteen had a paranoid form of schizophrenia. We were able to obtain BPRS scores in 19 of the 24 schizophrenic patients, with a mean of 51.5±9.5 (range 34-68).
Eight of the depressed patients received no psychopharmacological treatment at the time of the study, of the rest (n=15) all received either one (n=13) or two (n=2) antidepressants, five used lithium and one valproate. Five used antipsychotic drugs, mostly in small doses, and three used hypnotics or benzodiazepines. All the schizophrenic patients used antipsychotic drugs, 9 used clozapine, 8 used second generation drugs, 6 traditional antipsychotics, and two a combination of traditional and second generation drugs.
Recording of motor activity
Motor activity was monitored with an actigraph worn at the right wrist (Actiwatch, Cambridge Neurotechnology Ltd., England, UK). In the actigraph, activity is measured by using a piezoelectric accelerometer that is programmed to record the integration of intensity, amount and duration of movement in all directions. The sampling frequency is 32 Hz and movements over 0.05 g will be recorded. A corresponding voltage is produced and is stored as an activity count in the memory unit of the actigraph. The number of counts is proportional to the intensity of the movement. The right wrist was chosen to make the procedure more convenient for the participants, since most of them have their watches around the left wrist and it is cumbersome to have two such devices on the same arm. Previous studies have shown that there are only small differences between the right and left wrist.1920 Total activity counts were recorded for one minute intervals for a continuous period of at least 12 days for all participants. Patients were instructed to remove the actigraphs when taking a bath/shower, and to record these time intervals. The recorded activity counts (0) in these sequences were then replaced with the mean for the whole recording period.
Mathematical analyses
Each recorded interval (one minute) was defined as either active or inactive, according to whether the activity count was above (or equal to) or below 10% of the mean for the whole recording period (17280 minutes) for that participant. An active or inactive period was defined as a continuous sequence of active or inactive intervals, and each recording was in this way divided into active or inactive periods with a length from one minute and upwards. For each recording the cumulative probability (P) that an active or inactive period had a length of ≥A minutes was determined. For both active and inactive periods the following values of A were used: 1 to 5 with one minute intervals, 6 to 101 with 5 minute intervals, 151 to 451 with 50 minute intervals. For each participant the following numbers were calculated: mean activity count for the whole recording period, mean duration for active and inactive periods, and the longest active and inactive period. From the previous works of Nakamura et al.13 and Sano et al.14 we assumed we would find an approximately straight line on a log-log plot of A (minutes) versus P for inactive periods in both patient groups and controls, suggestive of a power law distribution, and a stretched exponential function for the active periods. However, in preliminary analyses of our data, we found that for low values of A (≤35 min for active sequences and ≤20 min for inactive sequences) it seemed that a straight line best fitted the data on log-log plots. We therefore decided to calculate the slope of the line (the scaling exponent of a corresponding power function) that best fitted the data using the least squares method, using these values of A. The slope is negative, but in the table absolute values are given. We also calculated the number of active periods (expressed as % of all the active periods) with a length (A) of 36 min or longer, and the number of inactive periods (% of all the inactive periods) with a length (A) of 21 min or longer.
Statistics
One-way ANOVA was employed to evaluate differences between groups, with the p-value set at 0.05, and post hos Bonferroni tests. Pearson's correlation coefficient was employed to evaluate correlations. SPSS version 18 was used was used for the statistical analyses.
RESULTS
The amount of time (mean±SD) the actiwatch was removed from the arm was 1.0±0.9% of the total time for control subjects, 0.4±0.4% for the schizophrenic patients and 1.0±1.4% for the depressed patients. Compared to the controls both the schizophrenic and the depressed patients had lower mean activity scores (33% and 28% lower) (Table 1). The longest active period overall was 821 min (a control subject) and the longest inactive period was 830 min (a schizophrenic patient). There were no significant differences between the three groups in the mean length of longest active period, but the mean length of the longest inactive period was significantly higher in the schizophrenic patients compared to controls (135% higher) (Table 1). The mean length of the active periods was significantly lower in the depressed patients compared to the controls (33% lower) (Table 1), while the schizophrenic patients had a higher mean value for inactive period duration compared to controls and the depressed patients (30% higher than controls) (Table 1). The depressed patients also have a lower percentage of active periods with a duration of 36 min or more, compared to both the controls and the schizophrenic patients (50% and 34% lower) (Table 1). Concerning inactive periods with a duration of 21 min or more, the depressed patients do not differ from controls, but the schizophrenic patients have a higher percentage of such periods compared to both the controls and the depressed patients (24% and 52% higher) (Table 1).

Actigraphic recordings of 12 days of motor activity (mean±SD)
In Figure 1 are shown the log-log plots of P vs. active periods with a duration ≤250 min for controls (Figure 1A), depressed (Figure 1B) and schizophrenic (Figure 1C) patients. From visual inspection of these figures it is obvious that, for the whole length of the curves, they do not follow straight lines. However, in Figure 2 the corresponding log-log plots of active periods with a duration ≤35 min for controls (Figure 2A), depressed (Figure 2B) and schizophrenic (Figure 2C) patients are shown, and all these three curves seem to be approximately straight lines, suggestive of power law functions. In Table 1 are shown the mean values for the slope of these lines, the value for the schizophrenic patients is lower than for controls, for the depressed patients it is higher, and the difference between the schizophrenic and depressed patients is statistically significant (the value for the depressed patients is 15% higher compared to the schizophrenic patients).
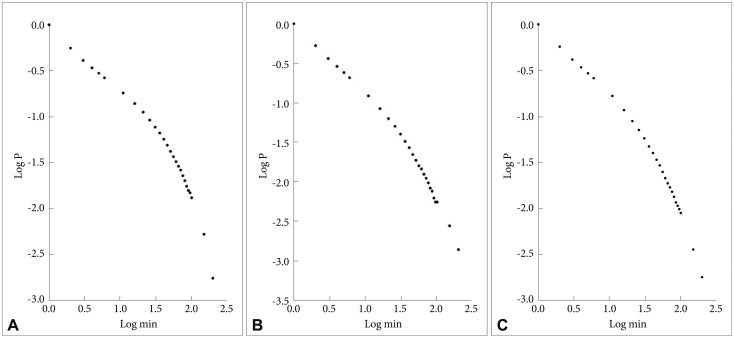
A: Log-log plots of cumulative probability (P) vs. duration of active periods (≤250 min) for controls. B: Log-log plots of cumulative probability (P) vs. duration of active periods (≤250 min) for depressed patients. C: Log-log plots of cumulative probability (P) vs. duration of active periods (≤250 min) for schizophrenic patients.
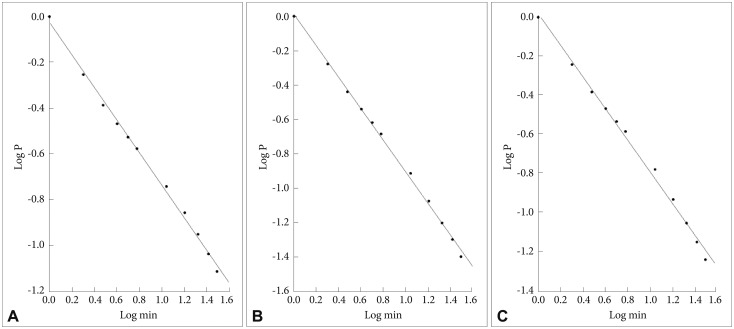
A: Log-log plots of cumulative probability (P) vs. duration of active periods (≤35 min) for controls. The straight line represents the linear regression line, using the least squares method. B: Log-log plots of cumulative probability (P) vs. duration of active periods (≤35 min) for depressed patients. The straight line represents the linear regression line, using the least squares method. C: Log-log plots of cumulative probability (P) vs. duration of active periods (≤35 min) for schizophrenic patients. The straight line represents the linear regression line, using the least squares method.
In Figure 3 are shown the log-log plots of P vs. inactive periods with a duration ≤250 min for controls (Figure 3A), depressed (Figure 3B) and schizophrenic (Figure 3C) patients. As for the active periods, visual inspections of these figures show that they do not follow straight lines. However, in Figure 4 the corresponding log-log plots for inactive periods with a duration ≤20 min for controls (Figure 4A), depressed (Figure 4B) and schizophrenic (Figure 4C) patients are shown, and all these three curves seem to be approximately straight lines. In Table 1 are shown the mean values for the slope of these lines, the value for the controls is lowest, the schizophrenic patients have a higher value (14% higher compared to controls), and the depressed patients have the highest value (32% higher compared to controls), statistically significant compared both to controls and to the schizophrenic patients.

A: Log-log plots of cumulative probability (P) vs. duration of inactive periods (≤250 min) for controls. B: Log-log plots of cumulative probability (P) vs. duration of inactive periods (≤250 min) for depressed patients. C: Log-log plots of cumulative probability (P) vs. duration of inactive periods (≤250 min) for schizophrenic patients.

A: Log-log plots of cumulative probability (P) vs. duration of inactive periods (≤20 min) for controls (A). The straight line represents the linear regression line, using the least squares method. B: Log-log plots of cumulative probability (P) vs. duration of inactive periods (≤20 min) for depressed patients. The straight line represents the linear regression line, using the least squares method. C: Log-log plots of cumulative probability (P) vs. duration of inactive periods (≤20 min) for schizophrenic patients. The straight line represents the linear regression line, using the least squares method.
When comparing males and females there were no significant differences for any of the parameters we used, when analyzed across the three groups (data not shown). Similarly there were no significant correlations for any of the parameters with age (data not shown).
In Table 2 are shown the correlations between some of the measures used in the present study. The most noteworthy findings are the very strong negative correlation between on one hand the scaling exponent of the inactive periods and the length of active periods (-0.890), and on the other hand the scaling exponent of the active periods and the length of the inactive periods (-0.721). In addition the scaling exponent of the active periods is strongly negatively correlated to the amount of active periods with a length of ≥36 min (-0.806), and the scaling exponent of the inactive periods is negatively correlated to the amount of inactive periods with a length of ≥21 min (-0.472).
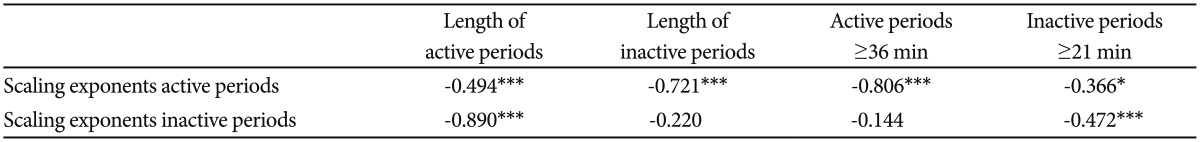
Correlations between current measures
In Tables 3 and 4 are shown correlations between measures in the present study and measures we have used in previous studies on motor activity in the same groups of patients and controls. The two nonparametric variables in Table 3 interdaily stability (IS) and intradaily variability21 are used to analyse behavioural rhythms.22 The IS quantifies the invariability between the days, the strength of coupling of the rhythm to environmental factors. The IV indicates fragmentation of the rhythm, that is, the transitions between rest and activity. In the patients with schizophrenia, IS is increased and IV is reduced, reflecting a more structured behavioural pattern.5 The most noteworthy findings from Table 3 are the significant correlations of IS to all the six measures used in the present study, with positive correlations to the mean lengths of both active and inactive periods and to the amount of long active (≥36 min) and inactive (≥21 min) periods. In Table 4 are shown correlations between two measures used to characterize short term variability and complexity in recordings of 300 min durations; standard deviation (SD) and sample entropy, a measure of complexity of time series.6 SD is negatively correlated to the length of active periods and to the amount of long active periods (≥36 min) and positively correlated to the scaling exponent of inactive periods. Sample entropy is also correlated to the same measures, but the correlation is positive to the length of active periods and to the amount of long active periods (≥36 min), and negative to the scaling exponent of inactive periods. Sample entropy is also positively correlated to the mean length of inactive periods and the amount of long inactive periods (≥21 min), while SD is negatively (but not significantly) correlated also to these two measures.

Correlations between current measures and rhythm analysis parameters

Correlations between current measures and measures of variability and complexity
DISCUSSION
The main finding of the present study is that patients with schizophrenia and depression have distinctly different profiles with regard to the distribution of active and inactive periods of motor activity. This adds to previously published results, with other mathematical methods, and suggests that there are important differences in control systems regulating motor behavior in these two major groups of psychiatric disorders.
In depressed patients, also using actigraph registrations, Nakamura et al.13 found that when examining the cumulative probability distribution (P) of inactive periods, with lengths (A) from 2 to 200 min, the relation of P to A on a log-log plot followed a straight line, suggestive of a power-law distribution, and the patients had a lower mean value for the scaling exponent compared to controls. This is the opposite of what we found, namely a higher value for the scaling exponent, and we have no clear explanation of this discrepancy. In agreement with Nakamura et al.13 we also found a straight line on a log-log plot of the relation P to A, but only for periods of A≤20 min, so obviously the distribution of the inactive periods, both in depressed patients and controls, is different in these two studies. The mean length of inactive periods of controls in the Nakamura study13 (inactive periods defined as non-zero activity counts) is quite similar to what we found (7.7 min vs. 6.0 min), but the depressed patients in their study has a substantially higher value (15.6 min vs. 5.9 min). However, it is important to note that the periods we have used to calculate the scaling exponents (having lengths ≤20 min) comprise approximately 93% of all the inactive periods, and in studies from a wide range of different fields it not unusual that power-law behaviour only applies to a restricted range of parameter values.23 We have not performed a more rigorous study of whether our distributions follows a strict power-law function,2324 but then our main purpose has not been to determine whether this is the case, but to look for differences between diagnostic groups.
In the study of Sano et al.,14 with similar methods, for the cumulative probability distribution of inactive periods, schizophrenic patients were also found to have a significantly lower value for the scaling exponent compared to controls. We did not find any difference between schizophrenic patients and controls in our study, but in agreement with Sano et al.14 we found that the schizophrenic patients had a higher value for the mean length of inactive periods compared to controls. In agreement with this the schizophrenic patients also had a higher value for longest inactive period compared to controls (135% higher). One difference between our patient groups is that we found a lower total activity count in the schizophrenic patients compared to controls, while Sano et al.14 did not find any such difference.
For active periods we found that the cumulative probability distribution (P) of these periods (A), using lengths (A) from 1 to 35 min, followed a straight line, when plotting P vs. A on a log-log plot. Nakamura et al.13 and Sano et al.14 did not find such a relationship, but instead a stretched exponential function, when using the whole range of lengths. We cannot therefore directly compare our results concerning scaling exponents, but while we found no significant differences between any of the patient groups and controls, we found that the depressed patients had a significantly higher value for the scaling exponent compared to the schizophrenic patients. Nakamura et al.13 did not find any differences between depressed patients and controls concerning parameter values for the stretched exponential functions, but Sano et al.14 found that the schizophrenic patients were different from controls. Concerning active period durations we did not find any difference between schizophrenic patients and controls, in agreement with Sano et al.,14 but the depressed patients in our study had a significantly lower value, compared both to controls and to schizophrenic patients.
We also looked at the number of active and inactive periods not employed for the calculation of the scaling exponents, that is active periods with a duration equal to or longer than 36 min and inactive periods with a duration equal to or longer than 21 min. This revealed a pattern that discriminated even better between schizophrenic and depressed patients than the use of scaling exponents. The percentage of these long active periods in relation to the total number of active periods was significantly lower in the depressed patients compared to both controls and to the schizophrenic patients. For the long inactive periods the percentage was higher in the schizophrenic patients compared to both controls and depressed patients. Therefore, even though the total activity counts are similar in the two patient groups, the depressed patients are characterized by fewer long activity periods, and the schizophrenic patients by a higher number of long inactive periods. These relationships are in reasonable agreement with clinical experience, and easier to grasp than the results from the calculation of scaling exponents.
The correlations presented in Table 2 underscore the relationships between the calculation of scaling exponents, duration of active and inactive periods and number of long active and inactive periods. These relationships are clearly interrelated, reflecting common mechanisms that regulate the transition between activity and rest.
There are moderate, but significant, correlations with parameters used in the rhythm analysis of van Someren,22 particularly interdaily stability (Table 3). The correlations are positive with mean lengths of active and inactive periods and number of long active and inactive periods, which is intuitively reasonable, since higher values of all these four measures presumably will tend to give a more stable rhythm. The correlations with the scaling exponents are negative, which again is reasonable given the results form Table 2, showing negative correlations between the scaling exponents and the other four measures.
In our previous paper on mathematical analyses of motor activity time series, we reported a strong negative correlation between sample entropy values and SD.6 The correlations between sample entropy and SD, taken from analyses of 300 min sequences in the same group of patients, and scaling exponents, duration of active and inactive periods and number of long active and inactive periods, show moderate correlations, which are not easy to interpret, but probably reflect common mechanisms in these aspects of motor activity regulation. However, it is interesting to note that when sample entropy shows a negative correlation, the correlation with SD is positive, and the other way around.
Sano et al.14 found that the parameter β of the stretched exponential function for active periods increased with age in schizophrenic patients. We did not find any correlations with age for any of our measures either in the whole study group or in the group of schizophrenic patients separately, neither did we find any correlation with scores on the Montgomery-Asberg Depression Rating Scale in the depressed patients or on the score on the Brief Psychiatric Rating Scale sin the schizophrenic patients (data not shown). However, we did not have patients with a wide range of severity, mainly moderately depressed outpatients and chronically ill, institutionalized schizophrenic patients. It would clearly have been an advantage to have a more heterogenous group in order to look at a possible relationship with severity. This also makes it difficult to know if our findings can be generalized to other groups of depressed and schizophrenic patients.
Actigraphy has been useful in studies on sleep,25 and it is possible that mathematical analyses of actigraph registrations from periods with continuous motor activity626 combined with analyses of active and inactive periods during longer registration periods may give a biological "signature" that can be useful for diagnostic purposes. It is obviously important if clinical impression of altered behavior can be supplanted with objective registrations of motor behavior. It will also be interesting to see if any of these measures can be used to predict effect of treatment, or be altered as the result of treatment. In the present study we used 12 days of registration, in the study of Nakamura et al.13 seven days were used, and in Sano et al.14 five days. However, to make this more applicable to clinical practice it would be useful to see if analyses of active and inactive periods can be reliably applied to shorter to time periods, such as one or two days.
In addition, new technological developments are adding exciting possibilities for future studies, including use of smartphones in combination with activity measurements.27
Treatment with psychotropic medication may of course have influenced our results, perhaps foremost the findings from the schizophrenic patients, but it is difficult to separate such an influence from genuine biological differences between the groups. We have previously reported that patients treated with clozapine differed from schizophrenic patients treated with other antipsychotics,5 but in the present study there were no significant differences between patients treated with clozapine and the other schizophrenic patients.
The gender distribution is different in the three groups and this could be a possible confounding factor. However, we did not find differences between genders for any of the analyzed parameters.
The mean age of the schizophrenic patients is higher than the other two groups, and this may also be a relevant confounding factor. However, again we did not find any significant correlations between age and any of the analyzed parameters.
We have not made a separate analysis of sleep parameters, and sleep may be altered both in depressed28 and schizophrenic patients.29 This may have influenced our findings, but on the other hand it would be very difficult to disentangle such effects from other effects on rest and activity rhythms. The controls in our study were employed and working, or students, while the patients were not. This is a potential source of bias that is difficult to evaluate. It would also have been desirable to have larger study groups and longer observation time, but this was not possible to accomplish with the resources we had available.
Participants were asked to remove the actigraphs while taking a bath or showering, but this comprises only short time periods, and is unlikely to have biased the results.
Diagnoses were assessed non-blind, but the actigraphic registrations and subsequent mathematical analyses did not require subjective evaluations.
Conclusions
Bursts of activity are shorter in duration in depressed patients, and there are fewer long active periods, while periods of inactivity are of longer duration in schizophrenic patients and there is a higher number of long inactive periods. Calculation of scaling exponents shows that the depressed patients are more different from controls than schizophrenic patients, both for active and inactive periods. Overall the results give the impression that the distribution of active and inactive periods is more disturbed in depressed compared to schizophrenic patients. In this paper, we have thus presented findings highlighting a difference between depression and schizophrenia. These diseases have long been regarded to be categorically distinct. However, we submit the methodology utilized may have wide-spread application in addressing important and in some instances controversial matters of importance to psychiatric nosology.
Acknowledgments
We want to thank Erlend Fasmer for making the programs for extracting the active and inactive sequences from the actigraph recordings.