Alterations in Spontaneous Brain Activity in Drug-Naïve First-Episode Schizophrenia: An Anatomical/Activation Likelihood Estimation Meta-Analysis
Article information
Abstract
Objective
The etiology of schizophrenia is unknown and is associated with abnormal spontaneous brain activity. There are no consistent results regarding the change in spontaneous brain activity of people with schizophrenia. In this study, we determined the specific changes in the amplitude of low-frequency fluctuation/fractional amplitude of low-frequency fluctuation (ALFF/fALFF) and regional homogeneity (ReHo) in patients with drug-naïve first-episode schizophrenia (Dn-FES).
Methods
A comprehensive search of databases such as PubMed, Web of Science, and Embase was conducted to find articles on resting-state functional magnetic resonance imaging using ALFF/fALFF and ReHo in schizophrenia patients compared to healthy controls (HCs) and then, anatomical/activation likelihood estimation was performed.
Results
Eighteen eligible studies were included in this meta-analysis. Compared to the spontaneous brain activity of HCs, we found changes in spontaneous brain activity in Dn-FES based on these two methods, mainly including the frontal lobe, putamen, lateral globus pallidus, insula, cerebellum, and posterior cingulate cortex.
Conclusion
We found that widespread abnormalities of spontaneous brain activity occur in the early stages of the onset of schizophrenia and may provide a reference for the early intervention of schizophrenia.
INTRODUCTION
Schizophrenia is a severe mental disorder with multiple symptoms and dysfunctions [1]. Epidemiological surveys have shown that the global prevalence of schizophrenia is about 1% and causes huge economic losses and tremendous pressure on families and society [2,3]. Resting-state functional magnetic resonance imaging (rs-fMRI) studies have suggested that functional abnormalities may contribute to the development and progression of schizophrenia.
rs-fMRI is a magnetic resonance technique that reflects the functional activity of a specific brain region through changes in the magnetic resonance signal produced by altered blood oxygen levels, and it is commonly used to study local brain functional changes using the amplitude of low-frequency fluctuation (ALFF) or fractional amplitude of low-frequency fluctuation (fALFF) and regional homogeneity (ReHo) [3-5]. These two methods have satisfactory stability and can be easily duplicated and does not need a priori hypothesis. ALFF uses the power of low-frequency signals to determine strong and weak neuronal activity in different brain regions, and is often used to measure blood oxygen level dependent signals in the frequency range of 0.01–0.1 Hz [6], while fALFF is a standardized ALFF method that can effectively suppress the effects of noise and has higher sensitivity and specificity in detecting spontaneous neural activity signals [7]. ReHo reflects the synchronization degree of neuronal activity in local brain area indirectly by calculating the consistency of time series between each voxel and adjacent voxels [8,9]. Therefore, the above methods have their own advantages in studying the functional changes of schizophrenia. They are commonly used to identify the local neural activity abnormalities in patients with schizophrenia and are considered to be a reliable imaging marker, but the results may be influenced by medication and duration of illness, thus leading to inconsistent results [8,10-13]. For instance, current cross-sectional studies found increased ALFF/fALFF and ReHo in putamen in first-episode schizophrenia [14,15], while others failed to replicate the above results in chronic patients [16,17].
To the best of our knowledge, a simultaneous meta-analysis of the two measures of spontaneous brain activity based on resting-state fMRI has not been performed. Gong et al. [18] conducted a meta-analysis to compare the differences in ALFF between first-episode schizophrenia and chronic schizophrenia. Xu et al. [19] included six studies on ALFF/fALFF and used the ALE method to compare the differences brain activity between schizophrenia patients and the control group. Additionally, Qiu et al. [3] conducted a meta-analysis comparing differences in ReHo among all schizophrenia patient groups, chronic schizophrenia groups, and healthy controls (HCs). However, studies have not fully elucidated the abnormalities in spontaneous brain activity in patients with drug-naïve firstepisode schizophrenia (Dn-FES) using ALFF/fALFF and ReHo, which might be due to the unavailability of data.
Anatomical/activation likelihood estimation (ALE) is a highly reliable coordinate-based meta-analysis method, which was developed by Turkeltaub et al. [20]. A random-effects model is constructed to fit each activation point into a probability distribution to obtain the ALE map [20]. Previous studies mostly focused on a single resting-state function index, and no researcher used the ALE software to study the specific changes in the brain function in patients with schizophrenia [21]. Therefore, it is crucial to use the ALE meta-analysis method to conduct a quantitative meta-analysis on neuroimaging studies at rest using ALFF/fALFF and ReHo to find specific markers in patients with Dn-FES.
To address the abovementioned issues, in this study, we used the accurate ALE algorithm to evaluate the two indices (ALFF/fALFF and ReHo) and determine specific alterations in Dn-FES. We hypothesized that both ALFF/fALFF and ReHo would elucidate abnormal changes in brain function.
METHODS
Literature selection
The meta-analysis of the studies that performed resting-state function imaging was conducted according to the Preferred Reporting Items for Systematic Reviews and Meta-analysis statement and recorded using the suggested checklist.
Search strategy
We obtained the studies published between the date of the first available date and January 2022 through a systematic and comprehensive search in the PubMed, Web of Science, and Embase databases. The retrieval strategy involved selecting studies with 1) “Schizophrenia” [Mesh] and (amplitude of low-frequency fluctuation [Title/Abstract] or ALFF [Title/Abstract] or fractional amplitude of low frequency fluctuation [Title/Abstract] or fALFF [Title/Abstract]) and (“resting state” or “functional magnetic resonance imaging” or “fMRI”); 2) “Schizophrenia” [Mesh] and (ReHo [Title/Abstract]) or Regional homogeneity [Title/Abstract]) and (resting-state [Title/Abstract] or functional magnetic resonance imaging [Title/Abstract]) or (fMRI [Title/Abstract]) (Supplementary Table 1 in the online-only Data Supplement).
Inclusion and exclusion criteria
In this meta-analysis, the inclusion criteria were listed as below: patients diagnosed with schizophrenia using the Diagnostic and Statistical Manual of Mental Disorders international standardized diagnostic criteria, who had first psychotic episode and not administered antipsychotic medication; studies that focused on rs-fMRI, with ALFF/fALFF or ReHo application; studies that were peer-reviewed original studies published in English language journals; studies that compared the two resting-state function indices between the Dn-FES group and the HC group.
In this meta-analysis, the exclusion criteria were listed as below: studies without the full text or those that did not improve the coordinates of the human brain and studies that were unavailable even after communicating with the author over the telephone or mail; studies involving subjects with psychiatric disorders besides schizophrenia (comorbidity); studies that were not based on ALFF/fALFF or ReHo.
Data extraction and quality assessment
Literature search, screening, and data extraction were conducted by two psychiatrists (X.L.Q. and R.R.Z.) who had received consistent training. Any differences in opinions and doubts were resolved by two senior psychiatrists (L.W. and H.J.M). Data were extracted for the name of the author, sample size, sex, age, course of the disease, positive and negative syndrome scale (PANSS) total score, full width at half maximum, and coordinate. The ten-point checklist was used to assess the quality of each study [3].
Data analysis procedures
The ALE software (http://www.brainmap.org) [22] was used to perform a meta-analysis of the differences in ALFF/fALFF and ReHo between Dn-FES and HCs. According to the findings of the two different approaches (ALFF/fALFF, ReHo), we divide them into four groups: increased ALFF/fALFF group (number of foci=37, n=715), decreased ALFF/fALFF group (number of foci=29, n=630), decreased ReHo group (number of foci=11, n=166), and increased ReHo group (number of foci=17, n=272). First, we put the extracted peak coordinate information in independent text, imported it into the ALE software, and transformed Talairach coordinates into Montreal Neurological Institute coordinates. Then, we performed the false discovery rate multiple comparison correction, with the p-value set to 0.05, [23] and the ALE brain map was visualized using the BrainNet software (http://www.nitrc.org/projects/bnv/) running in the Dpabi environment.
RESULTS
Search results and sample features
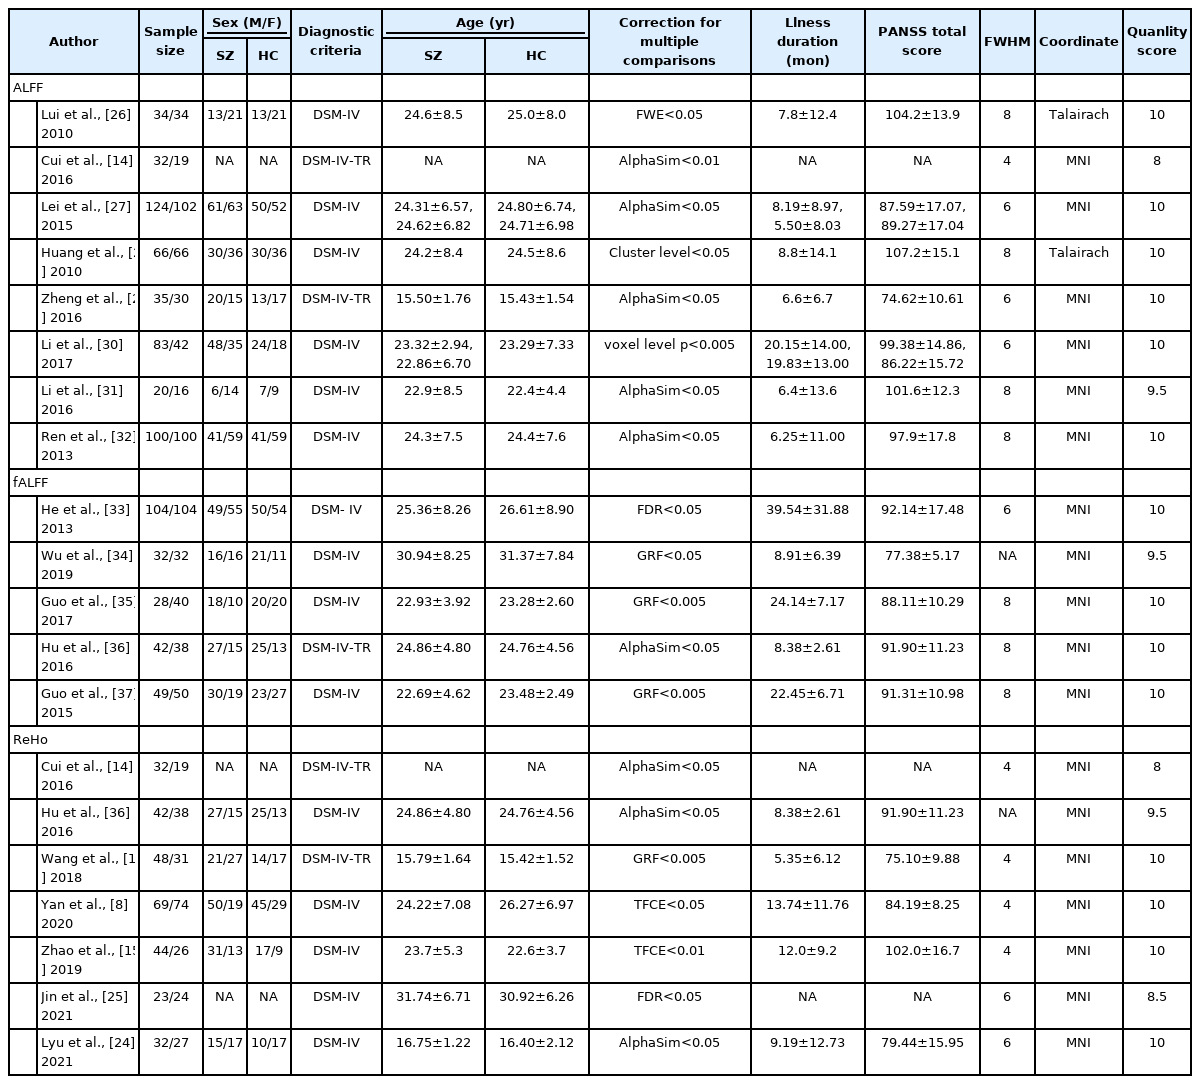
A total of 549 studies were searched in three databases (PubMed, n=98; Embase, n=164; Web of Science, n=287). After deleting duplicate studies and screening titles and abstracts, we found 39 potentially eligible studies for inclusion. Then, after a detailed review of the full texts, 18 datasets of rs-fMRI studies, 1,039 Dn-FES patients, and 1,425 HCs were included in our meta-analysis [8,10,14,15,24-37]. The sample characteristics and imaging information of the included studies are shown in Table 1 and Figure 1.
The amplitude of low frequency fluctuation/fractional amplitude of low-frequency fluctuation specific brain alterations in drug-naïve first-episode schizophrenia
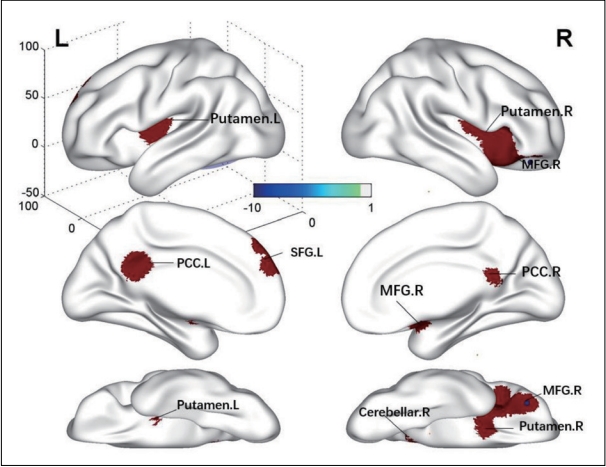
We found higher ALFF/fALFF in the bilateral putamen and the posterior cingulate cortex (PCC), right cerebellum, right middle frontal gyrus (MFG), and left superior frontal gyrus (SFG) of Dn-FES patients compared to that of the HCs (Table 2, Figure 2). Significant abnormal reduction in the brain areas was not found in Dn-FES.
Regional homogeneity specific brain alterations in drug-naïve first-episode schizophrenia
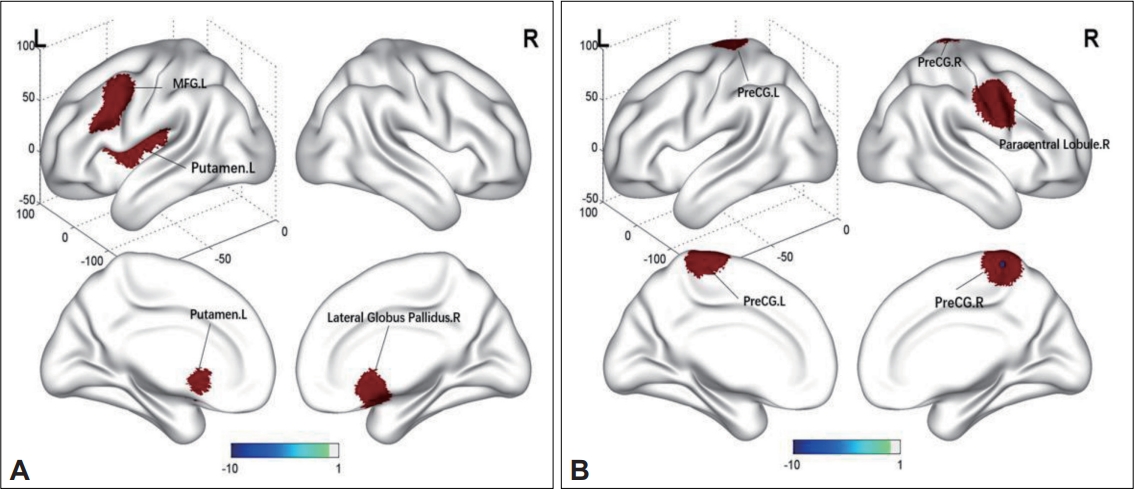
We found higher ReHo in the left putamen, MFG, insula, and right lateral globus pallidus (Table 2, Figure 3), and lower ReHo in the right paracentral lobule and bilateral precentral gyrus (PreCG) in Dn-FES patients compared to those of the HCs (Table 2, Figure 3).

Brain regions with specific alterations in ReHo in Dn-FES compared to HCs. A: Increased ReHo in Dn-FES compared with HCs. B: Decreased ReHo in Dn-FES compared with HCs. ReHo, regional homogeneity; MFG, middle frontal gyrus; PreCG, precentral gyrus; L, left; R, right; Dn-FES, drug-naïve first-episode schizophrenia; HC, healty control.
DISCUSSION
This was the first systematic meta-analysis investigating rsfMRI-specific alterations in ALFF/fALFF and ReHo in patients with Dn-FES. We found that both ALFF/fALFF and ReHo values were altered in Dn-FES. In Dn-FES, higher ALFF/fALFF values were mainly in the putamen, MFG, PCC, SFG, and cerebellum; however, no brain region with lower ALFF/fALFF was identified. Moreover, our study showed higher ReHo in the putamen, MFG, insula, and lateral globus pallidus, and lower ReHo in the right paracentral lobule and Pre-CG in Dn-FES. These results provided new insights into the neurophysiological mechanism of Dn-FES.
We found higher ALFF/fALFF in the bilateral putamen and higher ReHo in the left putamen and right lateral globus pallidus. The putamen and lateral globus pallidus are important components of the striatum. Several studies have demonstrated abnormalities in the striatum in schizophrenia [36,38,39]. If destroyed, it may lead to dopamine release disorder in the striatum, resulting in mental symptoms. Sui et al. [39] found higher fALFF in the striatum and thalamus of patients with schizophrenia. Furthermore, higher spontaneous neural activity in the striatum was significantly associated with positive symptoms. The dysfunction of the striatum may be the basis of schizophrenia. Moreover, a longitudinal study showed higher fALFF and ReHo in the putamen before treatment; after eight weeks of treatment, fALFF and ReHo in the putamen increased further [36]. These results suggested that the striatum might be a relatively stable imaging biomarker for schizophrenia, independent of the duration of illness and medication.
The default mode network (DMN) is a set of key brain regions, including the PCC, medial prefrontal cortex, angular gyrus, and other important nodes [40]. It plays a significant role in stimulating independent thoughts and monitoring the external environment [5]. Abnormal alterations in the spontaneous brain activity of the DMN occur in schizophrenia [41]. By performing resting-state fMRI, a study found that the DMN connectivity increased in patients with schizophrenia; thus, these findings are in accordance with findings reported by our meta-analysis [42]. A recent systematic literature review of rs-fMRI showed a decrease in the DMN activity in the schizophrenia group compared to that of the HC group [3]. Another study found mixed results regarding the changes in the DMN of schizophrenia patients [43]. The differences in the results of the above studies may be due to the influence of confounding factors such as duration of the disease course, administration of antipsychotics, or sample size. Therefore, including data of more patients and using specific neuroimaging markers associated with the DMN are essential for understanding the pathophysiological mechanisms of schizophrenia.
In our meta-analysis, we also found an increase in ALFF/fALFF in the left SFG and right MFG, an increase in ReHo in the left MFG, and a decrease in ReHo in the bilateral PreCG and the right paracentral lobule. These regions are components of the frontal lobe. Some researchers found that the frontal lobe, which is the most commonly affected region in schizophrenia, is the hub of high-level intellectual activities involving cognition, clinical syndrome and thought disorder [3,44]. By performing functional MRI, a study showed that the spontaneous neural activity of the frontal cortex was increased in people with chronic schizophrenia [45]. In the aspect of Dn-FES, another study showed increased regional functional abnormalities in the frontal lobe [8]. Thus, abnormal spontaneous activity in the frontal lobe may be a reliable biomarker for schizophrenia, and the simultaneous increase and decrease in the spontaneous activity in the frontal lobe may be a compensatory mechanism in the early stages of psychiatric illness. Based on the nature of the study, the results need to be interpreted carefully.
We also found an increase in ReHo in the left insula of patients with Dn-FES. The insula is one of the major nodes of the Salience Network, which helps in adjusting the DMN and the central execution network [46]. These internal networks influence each other and play a common role in various activities [13]. Abnormal functions in one of the resting networks in patients with schizophrenia may result in misprojection of internal and external information, presenting symptoms such as auditory hallucinations and cognitive disorder [43,44]. By performing rs-fMRI, a study showed that functional activity of insula in schizophrenia group was abnormal compared with HCs group, consistent with our findings [47]. These results suggested that abnormalities in the insula might be the basis of schizophrenia. Other abnormal brain regions, such as the cerebellum, also play a major role in patients with schizophrenia [48]. Typical features of cerebellar impairment include deficits in working memory, emotion regulation, verbal and visuospatial learning.
Limitations
Although we found promising results, some limitations of this study need to be mentioned. First, although we tried to maintain homogeneity of the sample, it was not always possible to do so because the software could not account for the influence of the PANSS score, head motion and the duration of the disease on the results. Another limitation, publication bias must be mentioned, negative results cannot be published, and the quality of research can lead to it [49]. Because ALE software is only suitable for the research that reported the peak coordinates, we cannot include the studies that did not report any cluster, but we conduct a perfect retrieval strategy to find out all the published literature, strictly evaluate the quality of all the included original research, and exclude low-quality research, so as to minimize the publication bias. Nevertheless, we need to interpret the results carefully. Moreover, this meta-analysis was based on whole-brain analysis, and no specific analysis of various networks in the brain was performed.
Conclusion
This was the first meta-analysis to systematically evaluate abnormal changes in the spontaneous neural activity of patients with Dn-FES by measuring different indices. We found varying degrees of increase and decrease in the spontaneous neural activity in Dn-FES patients, including activities in the frontal lobe, putamen, lateral globus pallidus, insula, cerebellum, and PCC. This study provided new insights into the pathophysiological mechanisms of Dn-FES from different perspectives.
Supplementary Materials
The online-only Data Supplement is available with this article at https://doi.org/10.30773/pi.2022.0074.
Search terms for the literature search
Notes
Availability of Data and Material
The datasets generated or analyzed during the study are available from the corresponding author on reasonable request.
Conflicts of Interest
The authors have no potential conflicts of interest to disclose.
Author Contributions
Conceptualization: Shiping Xie, Xinming Pan. Data curation: Xiaolei Qiu, Rongrong Zhang. Formal analysis: Xiaolei Qiu. Funding acquisition: Shiping Xie, Xiaolei Qiu. Investigation: all authors. Methodology: Xiaolei Qiu, Rongrong Zhang, Lu Wen. Project administration: Shiping Xie, Xinming Pan. Resources: Rongrong Zhang, Wei Yan. Software: Xiaolei Qiu, Lu Wen. Supervision: Shiping Xie. Validation: Shiping Xie, Xiaolei Qiu, Lu Wen. Visualization: Xiaolei Qiu, Hongjun Mao, Fuli Jiang. Writing—original draft: Xiaolei Qiu. Writing—review & editing: Xiaolei Qiu, Rongrong Zhang, Hongjun Mao, Wei Yan, Shiping Xie, Xinming Pan.
Funding Statement
This study was supported by the Project of science and technology benefits the people program of Jiangning (20212021NJNQKJHMJHXM0077) and the Key Project of Nanjing Municipal Bureau of Health 303 Commission (ZKX15033).
Acknowledgements
The authors express their deepest thanks to Mr. Jie Bai for helping to polish the manuscript.


