The Relationship Between Frontostriatal Connectivity and Striatal Dopamine Function in Schizophrenia: An 18F-DOPA PET and Diffusion Tensor Imaging Study in Treatment Responsive and Resistant Patients
Article information

Abstract
Objective
Striatal dopamine dysfunction caused by cortical abnormalities is a leading hypothesis of schizophrenia. Although prefrontal cortical pathology is negatively correlated with striatal dopamine synthesis, the relationship between structural frontostriatal connectivity and striatal dopamine synthesis has not been proved in patients with schizophrenia with different treatment response. We therefore investigated the relationship between frontostriatal connectivity and striatal dopamine synthesis in treatment-responsive schizophrenia (non-TRS) and compared them to treatment-resistant schizophrenia (TRS) and healthy controls (HC).
Methods
Twenty-four patients with schizophrenia and twelve HC underwent [18F] DOPA PET scans to measure dopamine synthesis capacity (the influx rate constant
Results
Non-TRS showed a negative correlation (r=-0.629, p=0.028) between connectivity of dorsolateral prefrontal cortex-associative striatum (DLPFC-AST) and dopamine synthesis capacity of associative striatum but this was not evident in TRS (r=-0.07, p=0.829) and HC (r=-0.277, p=0.384).
Conclusion
Our findings are consistent with the hypothesis of dysregulation of the striatal dopaminergic system being related to prefrontal cortex pathology localized to connectivity of DLPFC-AST in non-TRS, and also extend the hypothesis to suggest that different mechanisms underlie the pathophysiology of non-TRS and TRS.
INTRODUCTION
The dopamine hypothesis emerged from the discovery of antipsychotic drugs [1] and findings that the clinical effectiveness of antipsychotic drugs was directly related to their affinity for dopamine receptors [2-4]. It has been an enduring theory of the neurobiology in schizophrenia since then [5]. Consistent with this, recent meta-analysis has shown a large elevation in striatal dopamine synthesis in schizophrenia compared with matched healthy controls (HC) [6]. However, epidemiological data from the scientific literature report that approximately 20% to 35% of patients (termed treatment-resistant schizophrenia, TRS) show partial or no response to first-line antipsychotics [7] and molecular imaging studies have also reported that TRS shows lower striatal dopamine synthesis capacity compared with treatment-responsive schizophrenia (non-TRS) [8-10]. It has recently been suggested that there may be two different subtypes of schizophrenia (hyperdopaminergic and normodopaminergic) with differing neurobiological mechanisms and that the dopamine hypothesis can be only applied to hyperdopaminergic subtype [11,12].
It has been proposed that striatal dopamine dysregulation is the final common pathway to psychosis [13] and occurs secondary to prefrontal cortex (PFC) pathology [14-17]. Supporting this, imaging data have reported dorsolateral prefrontal cortex (DLPFC) hypoactivity correlated with increased striatal dopamine synthesis in patients with schizophrenia [18] and elevated subcortical dopamine function might adversely affect performance of the DLPFC in schizophrenia [19]. Moreover, the relationship between striatal dopaminergic dysfunction and abnormal PFC activation during cognitive tasks has been reported both in individuals at clinical high risk for psychosis and in patients with schizophrenia [20]. Furthermore, the most specific elevation in dopamine function has been found in associative striatum (AST) [21,22]. The AST receives afferent connections from the DLPFC [23] and the DLPFC-AST circuit is thought to play a critical role in psychosis, cognitive symptoms, and striatal dopaminergic dysregulation by PFC pathology [24-26]. However, multimodal imaging studies have suggested that the hypothesis of frontostriatal dysfunction in schizophrenia can be only applied to patients who respond to first-line antipsychotic medication [27,28]. Recent studies using positron emission tomography (PET), structural and functional MRI showed that frontal functional connectivity to AST significantly correlated with dopamine synthesis capacity in the corresponding region [28] and there was also an inverse correlation between grey matter (GM) volume in the DLPFC and dopamine synthesis capacity in the AST and the whole striatum in non-TRS, but no relationship in TRS [27]. However, there is no study till today that has investigated if frontostriatal structural connectivity is associated with striatal dopamine capacity in TRS and non-TRS.
Based on the previous studies regarding TRS and non-TRS [26], we firstly predicted reduced fractional anisotropy (FA) between the DLPFC and AST, reflecting reduced frontostriatal connectivity in tracts connecting the PFC with the associative subdivisions of the striatum in schizophrenia patients. Secondly, we hypothesized that there would be an inverse correlation between DLPFC-AST connectivity and dopamine synthesis capacity of AST in non-TRS, who are hypothesized to have a dopaminergic disorder. In contrast, we predicted that TRS would not show a relationship between striatal dopamine function and DLPFC-AST connectivity on the basis of the hypothesis that they do not show a dopaminergic disorder.
To test the hypothesis, we measured FA between the DLPFC and AST by using diffusion tensor imaging and dopamine synthesis capacity (indexed as the influx rate constant
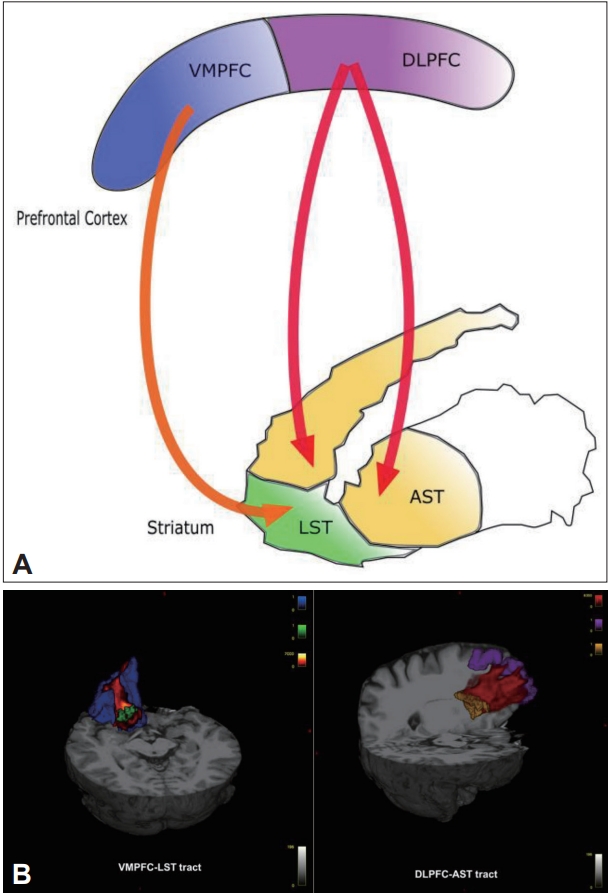
Frontostriatal tracts for one hemisphere and three-dimensional renderings of cortical regions of interest. Panel A shows a diagram of frontostriatal connections for one hemisphere. Panel B shows three dimensional renderings of frontocortical and striatal regions of interests (VMPFC in blue, DLPFC in purple, LST in green, AST in yellow, VMPFC-LST tract in orange, DLPFC-AST tract in red). VMPFC, ventromedial prefrontal cortex; DLPFC, dorsolateral prefrontal cortex; LST, limbic striatum; AST, associative striatum; VMPFC-LST, ventromedial prefrontal cortex-limbic striatum; DLPFC-AST, dorsolateral prefrontal cortex-associative striatum.
METHODS
Study procedures were approved by the Institutional Review Board of Seoul National University Hospital, Seoul, Korea (no. H-1209-098-428), and was carried out in accordance with the Helsinki Declaration of 1975, as revised in 2008.
Participants
After a full explanation of the study, all subject provided written informed consent to participate. Patients who met the following inclusion criteria were invited to participate in the study: 1) patients had to meet Diagnostic and Statistical Manual of Mental Disorders, Fourth Edition (DSM-IV) criteria for schizophrenia; 2) patients were required to have a total score of ≤80 in the Positive and Negative Syndrome Scale (PANSS) and no items with a score >4 on the positive subscale of the PANSS; 3) patients had to have maintained on their treatment regimen without change for at least 12 weeks prior to the study; 4) patients in non-TRS group had to have received first-line antipsychotic drugs to have no history of being refractory to first-line antipsychotic drugs or being given clozapine; 5) patients in TRS group had to have received clozapine with a history of non-response to at least two different first-line antipsychotics [30]; and 6) twelve healthy subjects (HC group) matched on age and sex were enrolled after the assessment of previous or current history of psychiatric illness by using the Structured Clinical Interview for DSM-IV Axis I Disorders, Non-Patient edition [31]. We also excluded participants with history of drug abuse or dependence. Clinical measures were assessed using the PANSS and the total antipsychotic dose was calculated using the chlorpromazine equivalent method [32,33].
PET scanning
Image acquisition
All participants were asked to fast and abstain from smoking and drinking from midnight on the day of the scan and received 400 mg of entacapone, a peripheral catechol-o-methyl-transferase inhibitor, and 150 mg of carbidopa to prevent formation of radiolabeled metabolites that may cross the blood-brain barrier [34]. Imaging data were obtained on a Biograph 40 Truepoint PET/CT scanner (Siemens, Knoxville, TN, USA) and after acquiring a computed tomography scan for attenuation correction, [18F] DOPA was administered by bolus intravenous injection of 370 MBq or less (10 mCi) of [18F] DOPA with minimum specific activity of 1.30×10⁷ Ci/mol. Head position was marked and monitored, and movement was minimized using a head strap. After routine corrections for uniformity, decay corrections, and attenuation (using the CT), the PET imaging data acquired in a list mode were reconstructed with a filtered back projection using a Gaussian filter. PET data were acquired for 95 min in a three-dimensional mode with 148 axial slices, an image size of 256×256, a pixel size of 1.3364×1.3364 mm2, and a slice thickness of 3 mm. The dynamic volumetric images were sequenced using the following framing: 2×30, 4×60, 3×120, 3×180, and 15×300 s.
Kinetic analysis
PET image analysis was performed as previously described [35]. Interframe correction for head movement during the scan was conducted by denoising the nonattenuation-corrected dynamic images using a level 2, order 64 Battle-Lemarie wavelet filter. Frames were hence realigned to a single ‘reference’ frame, acquired 8 min after injection, employing a mutual information algorithm [34]. The transformation parameters were then applied to the corresponding attenuated-corrected dynamic images. The realigned frames were then summated, creating a movement-corrected dynamic image, which was used in the analysis. Subsequently, the realigned images were spatially normalized by registering their summed image to the [18F] DOPA template created in a previous study [36]. Region of interest (ROI) time–activity curves (TACs) were hence extracted using atlas maps for the whole striatum, and its associative and limbic [37]. The cerebellum was used as the reference region as it is a region with minimal dopaminergic projections [38]. Finally, using the cerebellar TAC as a reference region input, the Gjedde–Patlak plot39 was applied at ROI to derive the Kicer relative to the cerebellum. The analysis was performed using a combination of SPM5 package (http://www.fil.ion.ucl.ac.uk/spm) and in-house code based on Matlab2012b (The Mathworks, Natick, MA, USA).
MRI scanning
Image acquisition
MRI data sets were acquired using a 3-T MRI scanner (Siemens Magnetom Trio, Erlangen, Germany) within 1 h after the PET scans. We obtained a high resolution T1-weighted structural MRI (TR=1,670 ms; TE=1.89 ms; 1-mm slice thickness, field of view=250 mm, FA=9°, matrix=256×256, 208 slices, voxel size=0.98×0.98×1.00 mm3). Diffusion weighted images were acquired using echo-planar imaging (TR=11,400 ms, TE=88 ms, matrix=128×128, field of view=240 mm, and a voxel size of 1.88×1.88×3.50 mm3). Diffusion-sensitizing gradient echo encoding was applied in 64 directions using a diffusion-weighting factor b of 1,000 s/mm2. One volume was acquired with b factor of 0 s/mm2 (without gradient).
Diffusion tensor imaging analyses
Preprocessing
Diffusion weighted data were converted from Digital Imaging & Communications in Medicine to analyze images. All data processing was performed using programs in the FMRIB Software Library (FSL) version 5.0.1 (http://www.fmrib.ox.ac.uk/fsl). Source data were corrected for eddy currents and head motion by registering all data to the first b=0 image, with affine transformation. In order to remove non-brain voxels, the Brain Extraction Tool (BET) was used to create a binary mask from the non-diffusion weighted data. A brain mask was created for the b0 image and applied to all diffusion-weighted images. Diffusion tensor and FA were then calculated by applying a single tensor model using the DTIFIT tool in FSL. In preparation for tractography, the data was also run through the program BEDPOSTX to build probability distributions on diffusion parameters and model for crossing fibres at each voxel [40]. FA ranges from 0 to 1, where 0 indicates regions with isotropic diffusion and 1 indicates perfect linear diffusion that is expected along the white matter (WM) fibers. Diffusion tensor imaging analyses must be performed in native space as diffusion gradients are specified in this space.
Regions of interest
The T1 data were processed using FreeSurfer (http://surfer.nmr.mgh.harvard.edu/) [41], an automated parcellation software program [42]. Targeted cortical regions were extracted from the surface-based procedure in FreeSurfer, based on cortical parcellation. The VMPFC is composed of two regions defined by FreeSurfer, the medial orbitofrontal cortex and lateral orbitofrontal cortex [42-45]. We also used the rostral middle frontal gyrus as the GM ROI that most likely represents the DLPFC [26,42,46]. Striatal ROI were hence extracted using atlas maps for the associative and limbic as previously described (Figure 1) [37]. Because all striatal subregions were defined in the Montreal Neurological Institute space, they were transformed into each individual’s native space using the talairach.m3z transformation [47].
Probabilistic tractography
Probabilistic tractography from the seed region (associative and limbic) to the target cortical regions (VMPFC and DLPFC) was performed using FSL’s ProbtrackX program with default options, both separately for each hemisphere and together for each subregion. These masks were transformed from each subject’s T1 image to his/her diffusion image space by applying the rigid body transformation matrix, which was calculated by use of FSL’s FLIRT program. To check the quality of the transformation, we visually inspected each mask in the diffusion space for each subject and confirmed that there were no gross transformation errors. Probabilistic tractography was performed in the diffusion space and final tractography results for each individual were visually inspected and thresholded at 10 % to remove voxels that showed extremely low connectivity. The resulting tracts were transformed back into the FA maps and then the mean FA value of each tract was calculated.
Statistical analysis
After confirming the data were normally distributed by using the Kolmogorov–Smirnov test, we used independent t tests and analysis of variance (ANOVA) to compare demographic variables between groups. Pearson’s χ2 test was used to test differences in the sex ratio between groups. In order to investigate connectivity differences between groups, a mixed-model ANOVA was used, with group as the between-subjects factor and hemisphere (left, right) and tract as the within-subject factors and then post hoc analysis using Bonferroni test was used. Associations between dopamine synthesis capacity (
RESULTS
Demographic and clinical data
Demographic and

Demographic characteristics and Kicer values of the sample
Neuroimage data
We found
Mixed model ANOVA showed a main effect for group for FA (F=3.470, df=2, p=0.043) in the four tracts of the frontostriatal connectivity. Post hoc analysis using Bonferroni test showed reduced FA in the right DLPFC-AST (mean difference=0.018, SE=0.007, p=0.046) and right VMPFC-LST (mean difference=0.023, SE=0.009, p=0.041) in non-TRS group but there were no significant FA reductions in any tracts in TRS group compared to HC (Figure 2).
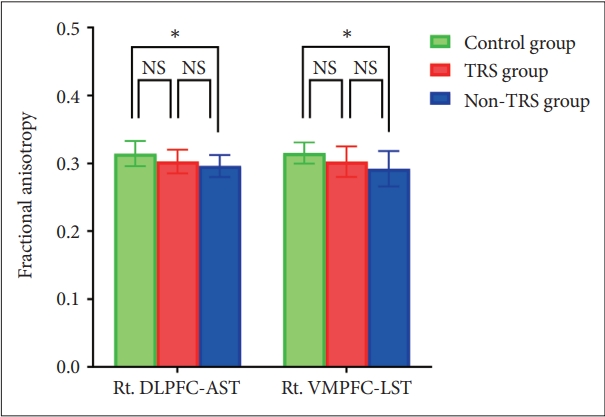
Bar graph of fractional anisotropy in the frontostriatal tracts for each group. Asterisks represent significant group differences (p<0.05, p-value adjusted after Bonferroni correction). NS, not significant; TRS, treatment-resistant schizophrenia; non-TRS, treatmentresponsive schizophrenia; Rt. DLPFC-AST, right dorsolateral prefrontal cortex-associative striatum; Rt. VMPFC-LST, right ventromedial prefrontal cortex-limbic striatum.
Dopamine synthesis capacity of left AST had a significant inverse correlation with FA in left DLPFC-AST tracts in non-TRS group (rho=-0.629, p=0.028) (Figure 3) but this was not evident in TRS (e.g., rho=-0.07, p=0.829). There was also no correlation in FA of VMPFC-LST with dopamine synthesis capacity in non-TRS group and TRS group. Moreover, we did not find any association between dopamine synthesis capacity and frontostriatal connectivity in HC (Table 2).
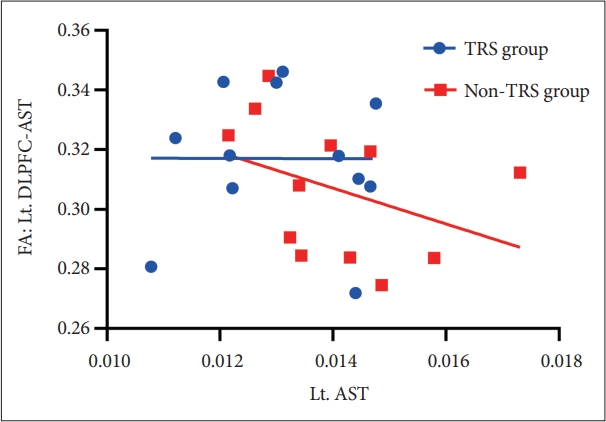
Scatter plot of the correlation between FA of the Lt. DLPFC-AST and in Lt. AST in first-line AP group (r=-0.629, p=0.028). FA, fractional anisotropy; Lt. DLPFC-AST, left dorsolateral prefrontal cortex-associative striatum;TRS, treatment-resistant schizophrenia; non-TRS, treatment-responsive schizophrenia; Lt. AST, left associative striatum.

Correlation between striatal dopamine synthesis (Kicer) and frontostriatal connectivity (FA)
DISCUSSION
To our knowledge, this is the first study to provide direct evidence that dopamine synthesis capacity in non-TRS is associated with frontostriatal connectivity. Our results showed that compared to HC, non-TRS have lower FA in both right DLPFC-AST and right VMPFC-LST, while TRS did not significantly differ in any frontostriatal connectivity. Also, our main finding revealed an inverse correlation between left DLPFC-AST connectivity and dopamine synthesis capacity in the left AST in patients with schizophrenia who respond to treatment, but no relationship in patients who do not respond to first-line treatment.
These results support further the theory that the neurobiology underlying TRS is different from that seen in non-TRS and the hypothesis of dysregulation of the striatal dopaminergic system being secondary to PFC dysfunction in schizophrenia [14-17], but critically also extend the hypothesis to indicate it can be only applied to non-TRS. Recent evidence from same participants of this study showed that there is an inverse correlation between GM volume in the DLPFC and dopamine synthesis capacity of AST in non-TRS, but no relationship in TRS [27] and our subsequent finding in the present study demonstrated direct evidence that DLPFC-AST connectivity is inversely associated with dopamine synthesis in AST.
While the association does not necessarily imply causality, overall there is a body of evidence suggesting that striatal dopaminergic system can be regulated by PFC function. Preclinical studies reported PFC lesions in rats increase striatal dopamine levels [48,49] and stress or drug challenges in the PFC evoke increased release of subcortical dopamine [50-52]. Human studies have found lower N-acetyl aspartate measures in DLPFC predict greater decrease in raclopride binding, caused by increased amphetamine-induced release of dopamine in patients [53] and decreased PFC activation also predicts exaggerated striatal fluorodopa uptake in patients [18]. Moreover, there is a progressive reduction in the integrity of the frontal WM before the onset of schizophrenia [54,55]. However, it should be recognized that some preclinical models also indicate that increases in striatal dopaminergic neurotransmission can lead to reduced frontal cortical function and striatal dopaminergic dysfunction can be also reciprocally linked to a cortical dopaminergic dysfunction [56-58]. Longitudinal studies are therefore needed to determine which is primary.
Corticostriatal dysfunction has long been implicated in the pathophysiology of schizophrenia, although the differential roles played by dorsal and ventral circuit in mediating disease risk have been unclear. Recent studies reported that structural connectivity of the DLPFC-AST is reduced in schizophrenia [26], and frontostriatal limbic loop was decreased in first-episode, treatment-naive schizophrenia [59]. We also found patients with non-TRS was significantly lower frontostriatal connectivity compared to HC and generally tend to have lower connectivity relative to TRS. To the best of our knowledge, no studies have so far examined WM microstructures specific to this pathway in patients with TRS compared to non-TRS. Interestingly, convergent with our findings, White et al. [60], using functional MRI, showed reduced functional connectivity compared with HC between dorsal caudate and PFC was specific to non-TRS which also displayed decreased connectivity between dorsal caudate and medial PFC when compared with TRS. Our findings, however, contrasts with a recent cross-sectional study that reported there are no differences in structural connectivity between ventral tegmental area (VTA), striata and DLPFC or between VTA, striata and VMPFC between non-TRS and TRS prior to starting clozapine, although exactly not overlapped with our study in seed-to-target regions [61]. Furthermore, findings by Reis Marques et al. [62] demonstrated that non-TRS had significantly higher FA than TRS across multiple regions including the uncinate, stria terminalis and superior frontal-occipital tract, commissural fibres, and several projections fibres, such as the internal and external capsule and corona radiata at baseline and at 12-week follow up after starting antipsychotics. We therefore need longitudinal study to further test if the difference of frontostriatal connectivity between TRS and non-TRS relative to HC in this study showed the different pathophysiology of two groups or was influenced by potential confounding factors including antipsychotic exposure.
Limitations of our study include the potential confound of antipsychotics treatment, including that of cumulative medication exposure, on our measurements of frontostriatal tracts, as WM integrity was affected in widespread brain after treatment with clozapine in recent study [63]. This study is also limited by its cross-sectional nature and longitudinal studies are needed to enable the assessment of the trajectory of WM connectivity changes over the course of the illness.
In conclusion, there is an inverse correlation between frontostriatal structural connectivity and striatal dopamine synthesis capacity in patients with schizophrenia who respond to first-line antipsychotic treatment, but no relationship in patients with TRS, who also show less disrupted WM connectivity compared to non-TRS. This suggests that different mechanisms underlie the pathophysiology of non-TRS and TRS. We also found frontostriatal structural connectivity is reduced more widely in non-TRS than in TRS compared to HC. Longitudinal studies are needed to determine the neurobiology related to WM connectivity for these two potentially different forms of schizophrenia.
Notes
Availability of Data and Material
The datasets generated or analyzed during the study are available from the corresponding author on reasonable request.
Conflicts of Interest
Euitae Kim, a contributing editor of the Psychiatry Investigation, was not involved in the editorial evaluation or decision to publish this article. All remaining authors have declared no conflicts of interest.
Author Contributions
Conceptualization: Euitae Kim, Sangho Shin. Data curation: Mattia Veronese, Katherine Beck, Jae Sung Lee, Yun-Sang Lee, Wi Hoon Jung, Sangho Shin. Formal analysis: Mattia Veronese, Katherine Beck, Jae Sung Lee, Yun-Sang Lee, Sangho Shin. Funding acquisition: Euitae Kim, Jun Soo Kwon. Methodology: Robert McCutcheon, Mattia Veronese, Katherine Beck, Jae Sung Lee, Yun-Sang Lee, Sangho Shin. Project administration: Euitae Kim, Jun Soo Kwon. Resources: Euitae Kim, Jun Soo Kwon. Software: Mattia Veronese, Katherine Beck, Jae Sung Lee, Yun-Sang Lee. Supervision: Euitae Kim, Oliver D. Howes. Validation: Mattia Veronese, Katherine Beck, Jae Sung Lee, Yun-Sang Lee, Sangho Shin. Visualization: Sangho Shin. Writing—original draft: Sangho Shin. Writing—review & editing: Oliver D. Howes, Euitae Kim, Robert McCutcheon, Wi Hoon Jung, Sangho Shin.
Funding Statement
This work was supported by the National Research Foundation of Korea (NRF) grants funded by the Korea government (MSIT) (No. 2022R1A2B5B02002400, NRF-2019M3C7A1032472).