Abnormal Dynamic Functional Connectivity of the Left Rostral Hippocampus in Predicting Antidepressant Efficacy in Major Depressive Disorder
Article information

Abstract
Objective
Some pharmacological treatments are ineffective in parts of patients with major depressive disorder (MDD), hence this needs prediction of effective treatment responses. The study aims to examine the relationship between dynamic functional connectivity (dFC) of the hippocampal subregion and antidepressant improvement of MDD patients and to estimate the capability of dFC to predict antidepressant efficacy.
Methods
The data were from 70 MDD patients and 43 healthy controls (HC); the dFC of hippocampal subregions was estimated by sliding-window approach based on resting-state functional magnetic resonance imaging (R-fMRI). After 3 months treatment, 36 patients underwent second R-fMRI scan and were then divided into the response group and non-response group according to clinical responses.
Results
The result manifested that MDD patients exhibited lower mean dFC of the left rostral hippocampus (rHipp.l) compared with HC. After 3 months therapy, the response group showed lower dFC of rHipp.l compared with the non-response group. The dFC of rHipp.l was also negatively correlated with the reduction rate of Hamilton Depression Rating Scale.
Conclusion
These findings highlighted the importance of rHipp in MDD from the dFC perspective. Detection and estimation of these changes might demonstrate helpful for comprehending the pathophysiological mechanism and for assessment of treatment reaction of MDD.
INTRODUCTION
Major depressive disorder (MDD) is a common, chronic, and recurrent mental illness typically defined as at least two weeks of abnormal low mood that exists in most situations continuously. Patients with MDD are often accompanied by loss of interest in usual delightful activities, hypersomnia or insomnia, feelings of inappropriate guilty, worthlessness, and recurrent thoughts of suicide or death [1,2]. In severe cases, those patients’ social function and cognitive function will gradually decline. MDD affects millions of individuals worldwide, about 350 million people in the world suffering from MDD, and it has become one of the main sources of the global encumbrance of disease [3]. Antidepressant medication is the current first-line therapy for MDD. Nevertheless, even after standard antidepressant treatment, the response rate is only 30%–40% [4]. Moreover, it takes several weeks for clinicians to decide the therapy reaction and whether to change the therapy scheme. This will prolong the excruciation of MDD patients and squander medical resources [4-6].
The acute treatment phase for MDD is generally considered to be 3 months of therapy [7]. In principle, clinicians strive to control the patients’ depressive symptoms within 3 months, achieve clinical cure as far as possible, and promote the recovery of function to the pre-disease level. The outcome and prognosis of the disease mainly depend on the efficacy of the acute phase, and 3-month is the significant time point for therapy. Thence, predicting the curative effect after 3 months of medical treatment will help clinicians select appropriate treatment options for continuation phase (3 months up to 12 months) and maintenance phase (>48 weeks). It will also improve the remission rate of patients with MDD. A previous meta-analysis based on research over the past 15 years revealed that different domains of biomarkers have already been tested for their capacity to predict antidepressant treatment response. Compared to cognition, proteins, electrophysiology or genetics, imaging biomarkers showed the highest predictive value, which might be useful for clinicians to predict outcomes and personalize antidepressant treatment [8].
Resting-state functional magnetic resonance imaging (R-fMRI) has offered an effective method to study intrinsic spontaneous brain activity without external task requirements [9]. Using R-fMRI, previous studies have given evidence of damage in hippocampal plasticity in patients with MDD [10], demonstrating that abnormalities in hippocampal function and structure might be a key component of the physiopathology of MDD. Meanwhile, previous studies have pointed out that smaller hippocampal volume and abnormal hippocampal functional connectivity (FC) might lead to dysfunction in emotion memory and regulation [11-13], especially for processing negative content of memory in MDD patients [14,15]. Moreover, increasing evidence has shown that the abnormal hippocampal FC might predict a bad curative effect after the acute phase treatment. A recent study reported the predictive value of hippocampal FC for the antidepressant efficacy after 2-week therapy [16], and another research revealed that the hippocampal FC patterns of brain regions between and within networks play an important role in identifying a favorable response of the 8-week medical treatment for MDD patients [17]. In animal research, antidepressant has been demonstrated to invert damaged neurogenesis and neuroplasticity in the hippocampus even after short-term therapy [18,19]. These above studies have revealed that the functional and structural abnormalities of the hippocampus are very important targets for predicting the efficacy antidepressant of MDD. However, previous studies only used conventional FC methods. Using this method, an implicit assumption is that FC remains constant for the entire duration of the fMRI scan. These time-averaged FC metrics neglected the dynamic nature of magnetic resonance imaging signals and the potential temporal variations of FC which might provide supernumerary information about brain function. This temporal fluctuation of FC is called dynamic functional connectivity (dFC). By using dynamic analytic techniques, we can track the variability in brain connectivity in different brain states [20]. Recent studies have revealed that, dFC can provide novel information on the temporal variability of rsFC and also the reoccurring resting-state FC (rsFC) patterns through time [21,22]. Currently, more and more research applied dFC to delineate the brain alterations in some neuropsychiatric diseases including attention deficit hyperactivity disorder, schizophrenia, and major depression disorder [23-25].
Meanwhile, the structural complexity and functional diversity of the hippocampus demonstrate the existence of structural and functional subdivisions within this structure. Many previous studies have revealed that different hippocampal subregions have different effects on different emotional and cognitive activities. There is plentiful data to prove that the anterior posterior part of the hippocampus, namely rostral, is highly associated with recollection of previous experience events and retrieval of unpleasant experiences, as well as modulating affective processing in particular of sadness and fear [26]. It suggests a specific role of the anterior hippocampus for the memory of emotionally relevant stimuli [27]. Meanwhile, evolutionary and functional neuroimaging evidence suggest that the right and left hippocampus have functional differences. Most have theorized that the right hippocampus is more associated with nonverbal, spatial functions and the left hippocampus with verbal memory functions [28]. One recent research revealed that using specific subfields of the hippocampus as biomarkers may improve the ability to choose the best first-time treatment strategy for newly diagnosed MDD patients [29]. Therefore, we speculate that the left rostral hippocampus might has important predictive value for the antidepressant efficacy in MDD patients. However, studies using the dFC indicator to study the specific hippocampal subregion and the improvement of response antidepressants are still blank.
The purpose of the current research is to reveal the importance of the dFC of specific hippocampal subregion as a neuroimaging biomarker and provide new evidence for the application of neuroimaging techniques in the therapy efficacy prediction, thereby guiding more individualized therapy for patients with MDD. We hypothesized that the baseline dFC of the left rostral hippocampal has a relationship between antidepressant efficacy and has the potential to predict the symptom improvement of MDD patients after 3-months pharmacotherapy.
METHODS
Participants
A total of 70 MDD patients (age, 26.93±9.14 years; 49 females, 21 males) were recruited in the present study from the Department of Psychiatry of Hangzhou Seventh People’s Hospital and the Affiliated Hospital of Hangzhou Normal University, Hangzhou, China. The patients were screened from a follow-up project, which aimed to assess clinical responses of MDD patients based on brain activity following 3-month pharmacological therapy. The diagnosis of patients was completed by psychiatrists in accordance with the Diagnostic and Statistical Manual of Mental Disorders, Fourth Edition criteria using the Mini-Neuropsychiatric International Interview [30]. Forty-three sex- and age-matched healthy controls (HC; mean±standard deviation age, 29.42±12.56 years; 27 females, 16 males) were enrolled from the local community. All MDD patients and HC participants were interviewed to confirm no history of organic brain disorder, neurological or medical illness, severe suicidal tendency, metallic implants or other contraindications to magnetic resonance imaging (MRI) circumstances, and substance dependence. The severity of depressive symptoms was evaluated using the 24-item Hamilton Depression Rating Scale (HAMD) at baseline and after 3 months of therapy for each patient with MDD. The HAMD scores of each HC participant are less than 3 points to ensure no depressive symptoms. All the procedures were executed according to the Declaration of Helsinki on Ethical Principles and approved by the local Institutional Review Boards of Hangzhou Normal University (IRB No. 20201124). Each subject provided written consent for participation after a full written and verbal explanation of the present study. Table 1 summarizes more comprehensive information about the subjects.

Clinical and demographic data
After initial psychiatric assessments, all participants underwent initial MRI scan. MDD patients were then treated with selective serotonin reuptake inhibitors according to the clinical judgment of the treating psychiatrist. The medication doses were stipulated and adjusted by the psychiatrist in accordance with current routine clinical practice. After 3 months of antidepressant treatment, only 36 (51.43%) of the 70 MDD patients were willing to undergo repeated MRI scan and clinical assessment in the follow-up study, and HC participants did not participate in the second MRI scan. The response group (23 of 36 subjects) was defined as a reduction of >50% in HAMD scores from baseline after 3 months of antidepressant treatment, and the non-response group (13 of 36 subjects) was defined as a reduction of <50% in HAMD scores from baseline [31].
MRI data acquisition
Imaging data of all subjects were gathered from the 3.0 T Discovery MR 750 scanner (General Electric, Waukesha, WI, USA) at the Center for Cognition and Brain Disorders at Hangzhou Normal University. The subjects were asked to keep relaxed with their eyes closed but not fall asleep and keep motionless during the scanning as much as possible. In order to stabilize the head and reduce movement, pair of stabilizers were used to immobilize subjects’ heads. Functional images were collected in an interleaved order using a T2*-weighted gradient-recalled echo-planar-imaging (EPI) sequence. Detailed collection parameters were as follows: echo time (TE)= 22 ms, flip angle=77°, repetition time (TR)=2,000 ms, matrix=96×96, field of view (FOV)=240×240 mm2 , 2.5 mm isotropic spatial resolution with 42 slices and 240 volumes. Highresolution T1-weighted anatomical images were received in sagittal orientation for visualization and localization of the functional images with fast spoiled gradient echo sequence (3D): TE=3.66 ms, flip angle=13°, TR=9 ms, matrix=300×300, FOV=240×240 mm2, 0.8 mm isotropic voxels, 176 slices without interslice gap.
MRI preprocessing
The processing of image data was conducted using a combination of the DPABI software [32], SPM (http://www.fil.ion.ucl.ac.uk/spm/) and custom code written in MATLAB (The MathWorks, Inc., Natick, MA, USA). The first 10 functional volumes of each subject were deserted to stabilize the scanner signals and ensure that the participants adapt themselves to the circumstances. The remaining 230 images were performed by slice timing correction and then realigned to the first volume for head motion correction. During the entire scanning process, all subjects had a maximum displacement of less than 2 mm in the x-, y-, or z-axes and an angular motion of less than 2°. To further control the confounding effects of head movement, the framewise displacement (FD) across time points was calculated for further analysis [33]. The 3D T1-based transformation was used to perform the spatial normalization of the functional images. The 3D T1 images were co-registered to mean functional images. The corrected images were spatially normalized into the standard stereotactic space of the Montreal Neurological Institute using the transformation, resampled into 3-mm isotropic voxels, and smoothed with a 6-mm full-width half-maximum Gaussian kernel. In order to further lessen the effects of confounding factors, we also regressed out the following sources: white matter signal, six motion parameters and cerebrospinal fluid signal. After band-pass filtering (0.01–0.1 Hz), we use the cubic spline method, that is, the “bad” time points were eliminated from the time series with a FD threshold of 0.5 mm to reduce the effects of head motion [34]. All images were visually inspected to guarantee the accuracy of registration, segmentation, skull stripping, and cortical surface reconstruction.
Sliding-window dynamic functional connectivity analysis of the left rostral hippocampus
The hippocampal subregions in the present study were defined according to the Human Brainnetome Atlas Project (http://atlas.brainnetome.org) [35]. This atlas provided a whole-brain parcellation of the human brain into distinguishing subregions based on the local structural connectivity architecture, namely, by identifying subregions that are maximally different from each other and maximally homogeneous internally in terms of their white matter connections. Each hemisphere of the hippocampus is sectioned into two distinct anatomical subregions, which include the rostral portion and the caudal part (Figure 1).

Four hippocampal subregions. rHipp.l, the left rostral hippocampus; cHipp.l, the left caudal hippocampus; rHipp.r, the right rostral hippocampus; cHipp.r, the right caudal hippocampus.
Using the left rostral hippocampus as a seed, we adopted a sliding-window approach to calculate the dFC for each participant [36,37]. We used a Hamming tapered window and iteratively sliding each window by 1 TR (2 s). In a Hamming window, the data at the beginning and end of the window are downweighed. To lessen low-frequency drift and respiratory or cardiac noise of high frequency, the data of every window were temporally bandpass filtered (0.01–0.1 Hz). By setting the window size to 22 TRs (44 s), we acquired 209 consecutive windows for each partcicpant [38]. Within each sliding window, we calculated the Pearson correlation coefficient between the window time series based on the seed and all other voxels in the whole brain. Using Fisher r-to-z transformation, the resulting correlation coefficients were converted to z-scores to improve normality. We acquired 209 z-score maps for each subject, representing the whole-brain dFC fluctuation for the left rostral hippocampus. Mean dFC strength was calculated by averaging the 209 dFC z-scores for each voxel. Therefore, we obtained voxelwise mean strength maps for the dFC with regard to the left rostral hippocampus for each participant.
Statistical analysis
The two-sample t-test was employed to compare the clinical and demographic data between MDD and HC, and between the res group and the non-res group. Age, sex, and head movement of the subjects were regressed as covariates. The chi-square test was employed to assess gender difference between MDD and HC. In order to control for multiple comparisons, family-wise error correction with Gaussian random field theory was employed, the voxel threshold was set to p<0.001 and the cluster threshold was set to p<0.0125 (0.05/4). Pearson correlation coefficients between the hippocampal dFC and HAMD scores were gauged in the MDD group. The significance level threshold was set to p<0.05.
We employed receiver operating characteristic (ROC) curves to estimate the possible predictive value of the hippocampal dFC that indicated significant between-group differences. We calculated the specificity and sensitivity of using dFC values to differentiate response patients and non-response patients. According to previous studies [29,39], the optimal level that leading to the highest combination of specificity and sensitivity was decided by calculating the maximum Youden index (Youden index=sensitivity+specificity-1) [40]. The area under the curve (AUC) was examined to explore the ability of classifying the MDD patients into different outcome groups.
RESULTS
Clinical and demographic characteristics
Table 1 shows the clinical and demographic characteristics of patients with MDD and HC, as well as the MDD patients in the response and non-response groups. There are no significant differences in sex (p=0.428) or age (p=0.226) between MDD and HC. Following 3-month antidepressant treatment, no significant differences were found in sex (p=0.636) or age (p=0.248), duration of illness (p=0.265), or baseline HAMD (p=0.422) between the response group and the non-response group.
Decreased dynamic functional connectivity of the left rostral hippocampus in major depressive disorder
As shown in Table. 2 and Figure 2, MDD patients showed lower mean dFC of the left rostral hippocampus primarily in the temporal lobe including the left superior temporal gyrus (STG.L), the right temporal pole (TPOsup.L), the right middle temporal gyrus (MTG.R), the left middle temporal gyrus (MTG.L), and the right precentral gyrus (PreCG.R) compared with HC (p<0.0125, GRF-corrected). In MDD patients, two significant correlations between the dFC of the left rostral hippocampus and the HAMD scores change (%) were observed in the STG.L (r=-0.427, p=0.009) and PreCG.R (r=-0.420, p=0.011). No significant correlations between the dFC of the left rostral hippocampus and the HAMD score changes were observed in other three clusters (TPOsup.L, MTG.R, and MTG.L) (Figure 3).

Brain regions showing significant difference in dFC between major depressive disorder patients and healthy controls
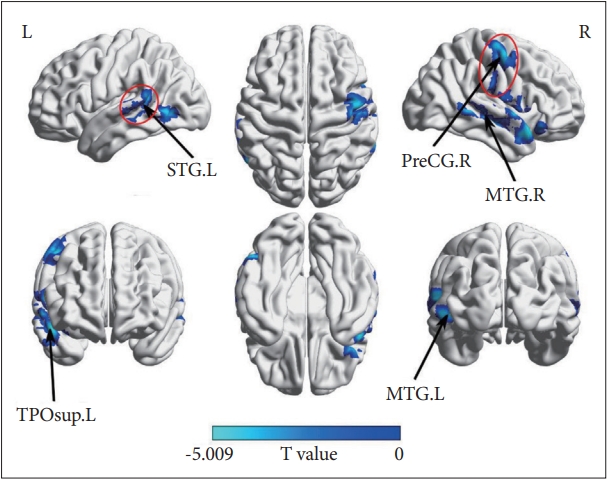
Group differences of dynamic functional connectivity between MDD patients and HC. The negative values (blue) mean MDD <HC, family-wise error-corrected (voxel p=0.001; cluster p<0.0125; one-tailed). MDD, major depressive disorder; HC, healthy controls; STG.L, the left superior temporal gyrus; TPOsup.L, the right temporal pole; PreCG.R, the right precentral gyrus; MTG.R, the right middle temporal gyrus; MTG.L, the left middle temporal gyrus.
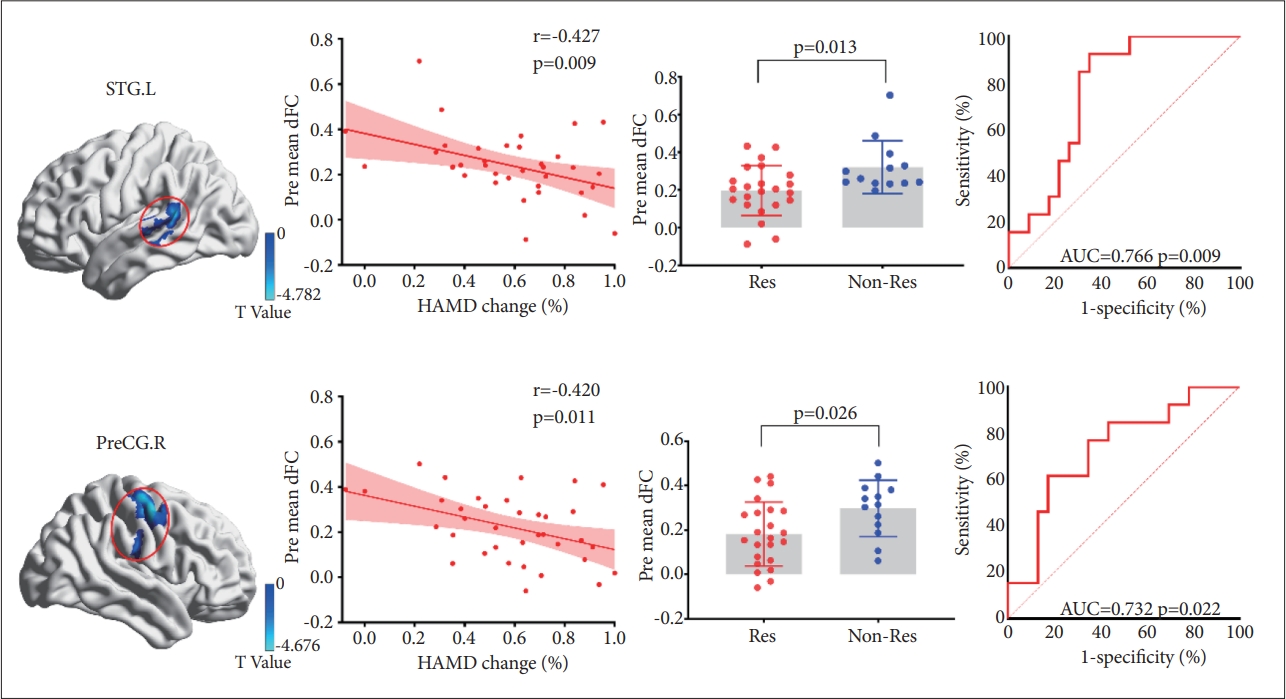
Different dFC of rHipp.l between patients in the Res and Non-Res groups. The figure shows brain regions with significant differences and the mean scores for the dFC of rHipp.l between patients in the Res group and Non-Res group (p<0.05), as well as the significant correlations between the HAMD change and dFC in the two regions. The ROC curve analysis revealed that rHipp.l dFC have positive effect to differentiated the Res group from the Non-Res group, in other words, predicting the antidepressant efficacy. dFC, dynamic functional connectivity; rHipp.l, the left rostral hippocampus; Non-Res, the non-response group; Res, the response group; HAMD, Hamilton Depression Rating Scale; ROC, receiver operating characteristic; STG.L, the left superior temporal gyrus; pre mean dFC, mean dynamic functional connectivity at baseline; PreCG.R, the right precentral gyrus; AUC, area under the curve.
Brain–therapeutic effect relationship
After 3 months of antidepressant treatment, the response group showed lower dFC of the left rostral hippocampus in the STG.L (p<0.05) and PreCG.R (p<0.05) compared with the non-response group. The other clusters (TPOsup.L, MTG.R, and MTG.L) did not exhibit significant differences between the response and non-response groups (p>0.05).
The AUC value of dFC between the left rostral hippocampus and STG.L for distinguishing the response group from the non-response group was 0.766, and the Youden’s index was 0.575 with a sensitivity of 0.923 and specificity of 0.652 (p=0.009). The AUC value of dFC between the left rostral hippocampus and PreCG.R was 0.732, and the Youden’s index was 0.442 with a specificity of 0.826 and sensitivity of 0.615 (p=0.022).
DISCUSSION
In the current study, patients with MDD showed lower dFC of the left rostral hippocampus with the temporal lobe and precentral gyrus compared with HC. After 3 months of antidepressant treatment, MDD patients were classified into two groups: the response and non-response groups. Compared to the non-response group, the response group showed lower dFC of the left rostral hippocampus with two regions including the STG.L and PreCG.R at baseline. These two baesline dFC were negatively correlated with HAMD changes following 3 months of antidepressant treatment in MDD patients. The ROC curves indicated the two baseline dFC had the ability to initially distinguish between the response group and the non-response group.
Previous studies have provided evidence for left lateralization of the hippocampus in MDD patients [26,28]. We selected the left rostral hippocampus as a seed region to characterize the abnormal dFC in the response group and the non-response group. Meanwhile, some research suggested the important role of the anterior hippocampus for the negative memory including sadness and disgust. Besides, one recent meta-analysis also emphasized the importance of the left anterior hippocampus in MDD patients [27]. Likewise, we found that the dFC of the left rostral hippocampus exhibited the capability to discriminate the initial remission of MDD patients in the present study. Thus, our research supported the presumption that the connectivity network of the left rostral hippocampus is closely related to MDD and has the potential to predict the initial symptom improvement.
The STG is quite important in language processing, auditory memory, and emotional processing. One meta-analysis has revealed that the left STG is one of the most consistently identified regions related to the pathophysiology of MDD, which is consistent with our findings. Meanwhile, previous studies found negative correlations between the unusual function of the STG.L and the therapeutic effect in patients with MDD patients, a recent study also showed increased gray matter volume in the STG after a series of emission computed tomography treatment in MDD. Combining with these findings, we conjecture that the reduced spontaneous activities in the STG might be a brain signal guiding the effective treatment response of MDD. The left STG is also a shared substrate for speech comprehension and auditory short-term memory, and highly participates in the semantic and syntactic process, which could explain the impaired semantic fluency in patients with MDD at the acute phase and recurrent stage of illness. Some studies also found that the STG was related to the concept of incentive salience, and motivated goal-directed behavior by associations with reinforcing events. In patients with MDD, abnormally reduced temporal lobe dFC signals might indicate decreased salience to rewarding events, which might further cause the patient’s anhedonia and the deepening of depressive symptoms. The precentral gyrus (PreCG) is the site of the main somatosensory cortex that is related to some important cognitive activities, including implicit learning [41], motor learning [42], and working memory [43]. MDD patients have been found to exhibit abnormities in structure and function for the PreCG [44-46]. Furthermore, advanced control relevant activation in the PreCG is involved in suicide risk in MDD patients [47,48]. Therefore, we have reasons to consider that the abnormal dFC between the rHipp.l and PreCG might be linked to abnormal excessive suicidal beliefs and suicidal behaviors in MDD patients. Furthermore, the gray matter volume of the PreCG in MDD may be associated with avoidance motivation, which is one of the most significant features for MDD patients [49]. Most importantly, the PreCG was found to be involved in negative attribution bias [50]. Internal attributions of events, where the self was considered as an active intentional agent, involved the PreCG. Abnormal activation of the PreCG may cause MDD patients to use fewer “self-service” attribution manner than HC, which could explain the feelings of excessive or worthlessness or inappropriate guilt in MDD patients.
Several limitations of the current study should be solved in future studies. First of all, the sample size of MDD patients was not big enough, which might reduce the generalizability of the present study. Large sample studies are needed in the future to examine the reproducibility of ourfindings. Second, our longitudinal study had limited investigations, future research should focus on its shortcomings and improve them. Last, antidepressant treatment effect in the present study is for pharmacological treatment, and the treatment effect of other treatment protocols is worthy of being studied carefully.
In conclusion, we found that MDD patients have lower dFC of the left rostral hippocampus with the STG.L and PreCG.R, which was related to improvement after 3 months of antidepressants treatment. The dFC of the two regions could distinguish between the response group and the non-response group, that is, predicting the symptom improvement. The current findings might provide new insights and ideas for predicting antidepressant efficacy in patients with MDD.
Notes
Availability of Data and Material
The data that support the findings of this study are available from the corresponding author upon reasonable request.
Conflicts of Interest
The authors have no potential conflicts of interest to disclose.
Author Contributions
Conceptualization: Shao-Wei Xue. Data curation: Changxiao Kuai. Formal analysis: Changxiao Kuai. Funding acquisition: Shao-Wei Xue. Investigation: Changxiao Kuai. Methodology: Changxiao Kuai, Yang Xiao. Project administration: Shao-Wei Xue. Resources: Shao-Wei Xue. Supervision: Shao-Wei Xue. Validation: Shao-Wei Xue. Visualization: Changxiao Kuai. Writing—original draft: Changxiao Kuai, Zhihui Lan, Yang Xiao, Lei Zhao. Writing—review & editing: Shao-Wei Xue.
Funding Statement
This work was supported by the Zhejiang Medical and Health Science and Technology Project (2022KY1055), Natural Science Foundation of Zhejiang Province (LY17H180007), National Natural Science Foundation of China (81271503), Key Medical Disciplines of Hangzhou and Affiliated Hospital of Hangzhou Normal University (KY21085).
Acknowledgements
The authors thank the teachers and students who assisted in the experiment and data collection.