Exploratory Structural Equation Modeling Analysis of the Social Network Site Use Motives Scale
Article information

Abstract
Objective
Social Network Site Use Motives Scale (SUMS) was developed under the assumption that it consists of six factors, but only four factors were extracted as a result of Exploratory Factor Analysis. The goal of the present study was to investigate whether SUMS consists of four or six factors using Confirmatory Factor Analysis (CFA) and Exploratory Structural Equation Modeling (ESEM) approach.
Methods
A Korean college student sample (n=600; mean age, 21 years; 58% female) filled out the SUMS and the Social Network Site Addiction Proneness Scale. CFA and ESEM were used to assess the factor structure of the SUMS.
Results
Results indicated that a four-factor solution to the SUMS had inadequate fit in the sample examined using both CFA and ESEM and a six-factor solution to the SUMS had insufficient fit using CFA, whereas fit was optimal using ESEM for the six-factor model. In addition, the scale showed adequate convergent validity and reliability.
Conclusion
These findings support the six-factor model of SNS use motives and suggest that ESEM is a more appropriate method than CFA for examining the factor structure of the SUMS. The results displayed the usefulness of the ESEM framework in the investigation of use motives.
INTRODUCTION
A social networking site (SNS) (Facebook, Twitter, Instagram, etc.) is an online vehicle for creating self-descriptive profiles, communicating with friends, and meeting other people who share an interest [1]. Prior research [2] has identified several reasons for using SNS: social interaction, pass time, information seeking, relaxation, entertainment, communicatory utility, expression of opinion, information sharing, convenience utility, and surveillance/knowledge about others. Although there are many benefits of using SNS, there are cases in which excessive use of SNS may lead to interpersonal and occupational dysfunction. A typical problem related to the use of SNS is SNS addiction. Andreassen and Pallesen [3] define SNS addiction, also known as social networking addiction or problematic SNS use, as “being overly concerned about SNS and driven by a strong motivation to log onto or use SNS and to devote so much time and effort to SNS that it impairs one’s other social activities, studies/job, interpersonal relationships, and/or psychological health and well-being.” Even though SNS addiction is not recognized as a diagnosable disorder in psychiatry manuals, it fulfills the core components of behavior addiction including salience, mood modification, tolerance, conflict, withdrawal symptoms, and relapse [1].
In recent years, SNS addiction has become prevalent in many countries. Cheng et al. [4] conducted a meta-analysis to examine the prevalence of SNS addiction in 32 nations across seven world regions and over 34,000 participants. According to their study, the prevalence of SNS addiction was highest in Africa (37%), followed by Asia (31%), Middle East (29%), Eastern/Southern Europe (20%), Latin/South America (18%), North America (15%), and Western/Northern Europe (8%). Also, Cheng et al. [4] found that SNS addiction prevalence was twice as high for people of collectivistic nations (31%) than those of individualistic nations (14%). Although Koreans were not included in their study, Korea is expected to show a high prevalence of SNS addiction because it is a country in Asia and at the same time one of the collectivistic nations.
It has been reported that SNS addiction may cause academic problems such as low academic achievement [5] and academic procrastination [6], social problems such as relationship dissatisfaction and romantic jealousy [7], occupational problems such as burnout and work-family conflict [8], or psychological problems like depressive symptoms [9] and shopping addiction [10]. Given these negative consequences associated with SNS addiction, it is important to examine the determinants of the initiation, development, and maintenance of SNS addiction to facilitate the proper management and intervention of SNS addiction.
Previous studies indicated that use motives are important to understand and intervene SNS addiction [11,12]. Initial SNS use motive model [13,14] which has been adapted from the traditional drinking motive model [15] categorized SNS use motives along two dimensions. The first dimension is the source of reward (internal vs external): people might use SNS because they hope to obtain an internal reward, or because they need to achieve an external reward. The second dimension is the valence of reward (positive vs negative): people might use SNS because they wish to obtain a positive outcome or because they hope to avoid a negative outcome. Crossing these two dimensions results in four categories of SNS use motives: 1) internal and positive motive (i.e., SNS use to increase positive affect); 2) internal and negative motive (i.e., SNS use to alleviate negative affect); 3) external and positive motive (i.e., SNS use to obtain social interaction and rewards); and 4) external and negative motive (i.e., SNS use to avoid negative social sanctions). These four SNS use motives have been labeled as enhancement, coping, social, and conformity motive, respectively. Recently, the motivational model of SNS use [12] proposed two additional use motives, which were pastime motive (i.e., SNS use to regulate boredom) and information motive (i.e., SNS use to obtain intellectual resources).
The SNS Use Motives Scale (SUMS) [12] was originally developed to measure the six factors of SNS use motive suggested in previous studies, including coping, enhancement, social, conformity, pastime, and information motives. Factor analysis of the SUMS indicated four domains underlying SNS use motive: 1) coping motive, 2) social-conformity motive, 3) pastime motive, and 4) information-enhancement motive. Conformity and social motives were combined to form social-conformity motive and enhancement and information motives to form information-enhancement motive [12].
Despite its appeal as a potential measure of SNS use motives, Shin and Lim’s factor analytic findings [12] need to be replicated, given that the four-factor structure they obtained did not correspond to the six-factor structure the inventory was originally designed to assess. Therefore, to address these problems, the present study examined the factorial validity of the SUMS in a relatively large sample with a newly developed method.
The factor structure of the SUMS was assessed with exploratory factor analysis (EFA) in the previous study [12]. The first aim of the present study was to determine whether the factor structure of the SUMS as suggested by Shin and Lim’s study [12] could be cross-validated in the independent sample using confirmatory factor analysis (CFA).
However, the CFA where items are hypothesized to load on their respective factors without allowing cross-loadings onto any of the other factors could lead to low model fit indices and inflated inter-factor correlations, limiting the discriminant validity of the scale [16]. ESEM has been suggested as an alternative method to CFA, combining the rigor of CFA and the flexibility of EFA. Because cross-loadings between the relevant factors can be expected, ESEM can yield a more precise estimate of correlation coefficients. ESEM showed better goodness-of-fit and reduced inter-factor correlations than CFA [17]. Thus, the second goal of this study was to show the usefulness and effectiveness of the ESEM method in examining factorial validity of the SUMS. To this end, in the present study, different methods (CFA vs. ESEM) to determine the factor structure of the SUMS have been compared to choose the most appropriate one. Based on the previous studies [16,17], it was expected that the ESEM solution would fit the data better than the CFA. In addition, the correlation coefficients between use motives were examined. Based on the previous studies [16,17], it was expected that the ESEM solution would show smaller inter-factor correlations than the CFA.
The final objective of this study was to examine the convergent validity, internal consistency, and test-retest reliability of the SUMS. For convergent validity, the relations between the SUMS factors and SNS addiction will be tested. According to previous studies of SNS use motives [12,18], it was expected that SNS addiction would be positively and significantly correlated with use motives.
METHODS
Participants
Using the convenient sampling method, six hundred college students were recruited from introductory psychology courses at a university located in Gyengbuk, South Korea. The ages of the participants ranged from 18 to 28, with a mean age of 21.17 (SD=2.06). The participants were 41.7% male and 58.3% female. This study was approved by the Daegu University Institutional Review Board (IRB # 2020-022-08).
Measures
The Social Network Site Use Motives Scale (SUMS)
The SUMS is a measure of SNS use motives [12]. The scale comprises 30 items. Respondents who indicated a history of SNS use were asked to rate on a scale from 1 (strongly disagree) to 5 (strongly agree). Drawing on factors identified in the previous use motives literature, the authors constructed the SUMS to measure information (“I use SNS to get new information”), enhancement (“I use SNS to have fun”), social (“I use SNS to get along with my friends”), conformity (“I use SNS is not to be left out”), coping (“I use SNS to forget my worries”), and pastime motives (“I use SNS to fill time”). In a sample of 401 nonclinical participants, Shin and Lim [12] found that the SUMS measured four factors: 1) information-enhancement motive, 2) social-conformity motive, 3) coping motive, and 4) pastime motive. The alphas for the factors of SUMS were 0.89–0.91 [12].
The Social Network Site Addiction Proneness Scale (SAPS)
The SAPS is a measure of SNS addiction [19]. The scale consists of 24 items, each representing one of the four factors including preoccupation and tolerance (“I spend a lot of time thinking about SNS or planning how to use it”), virtual life orientation and withdrawal (“I become irritated when prohibited from using SNS”), disturbance of adaptive life and control failure (“I use SNS so much that it has had a negative impact on my job/studies”), and avoidance of negative emotions (“I use SNS in order to forget about stressful problems”). Participants were asked to respond to each item using a scale ranging from 1 (strongly disagree) to 4 (strongly agree). In the present study, the sum of the SAPS was used for analyses. The alpha of the SAPS is 0.92 [19].
Procedure
Data collection was performed offline in 2018–19. Written consent was sought from each participant before data collection and the respondents completed a battery of self-administered questionnaires. Data collection was performed in classrooms in groups of about 40 people using pen or pencil, and a researcher was available to answer any queries arising from the questionnaires. Participants were assured of anonymity and confidentiality and were free not to take part in the study. The average time to complete the battery of questionnaires was about 15 to 20 minutes. Debriefing was conducted after completion of the questionnaires. As a reward for participating in the study, 1,000 won worth of school supplies were provided to the participants.
Data analyses
Data analyses were carried out using SPSS 21 (IBM Corp., Armonk, NY, USA) and Mplus 7.0 (Muthén & Muthén, Los Angeles, CA, USA). The factor structure was examined using CFA and ESEM with maximum likelihood estimation which assumes that the variables are continuous and follow a multivariate normal distribution. In the present data, skewness of all variables were found to be between -2 to +2 and kurtosis of all variables were found to be between -7 to +7, thus it can be considered that these data follow a multivariate normal distribution.
Four alternative models were tested and compared: 1) a six-factor model with CFA; 2) a six-factor model with ESEM (Figure 1); 3) a four-factor model with CFA, 4) a four-factor model with ESEM. In four-factor models (a four-factor model with CFA and a four-factor model with ESEM), all of the information and enhancement items were specified to load on information-enhancement motives, and all of the social and conformity items were specified to load on social-conformity items. In the CFA analysis, each item of the SUMS would have a non-zero loading on only the one factor it was designed to measure and a zero loading on each of the other three or five factors and the residuals would be uncorrelated. In the ESEM analysis, an oblique geomin rotation with an epsilon value of 0.5 was applied, and each item of the SUMS would be explained by four or six correlated factors. The ESEM analysis differs from CFA in that all possible factor loadings are estimated.
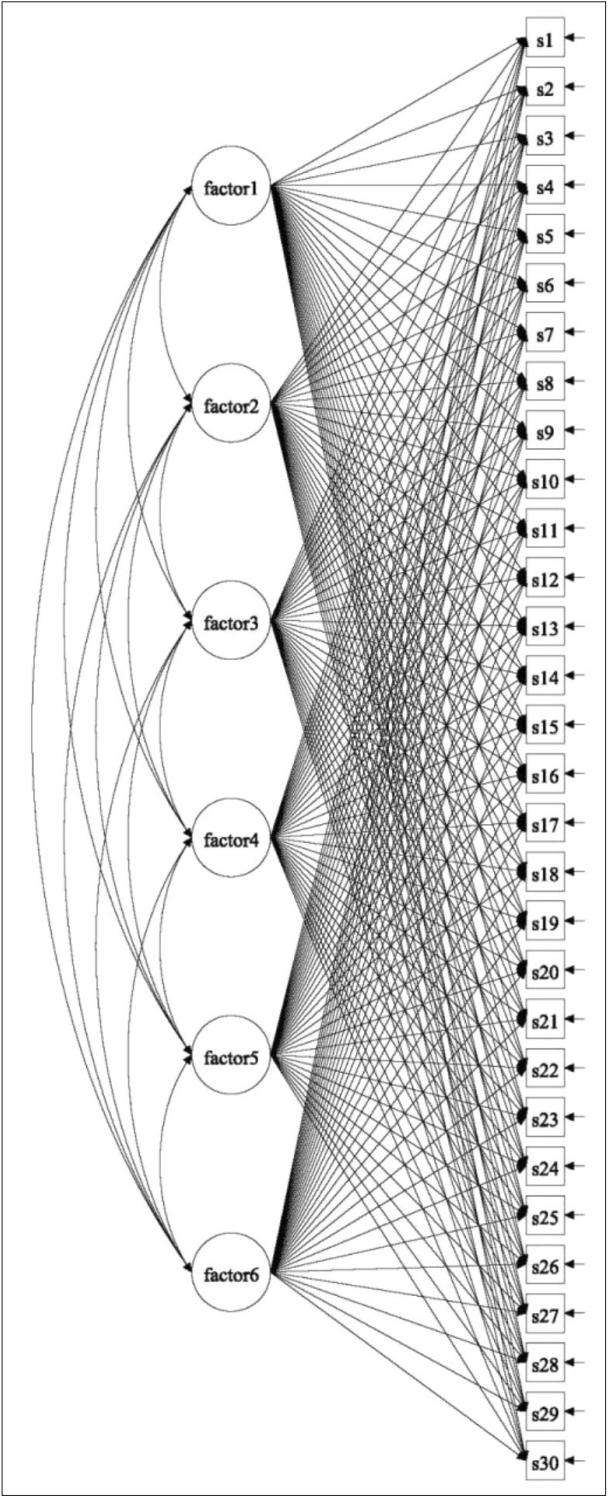
Exploratory structural equation modeling (six factor model). Factor 1, enhancement motive; Factor 2, conformity motive; Factor 3, pastime motive; Factor 4, social motive; Factor 5, information motive; Factor 6, coping motive.
A minimum cut-off of 0.95 for Comparative Fit Index (CFI), minimum cut-off of 0.95 for Tucker-Lewis Index (TLI), a maximum cut-off of 0.06 for Root Mean Square Error of Approximation (RMSEA), and a maximum cut-off of 0.08 for Standardized Root Mean Square Residual (SRMR) were considered as indication of acceptable fit [20,21]. However, as there are still insufficient studies on fit indices and cut-off scores in relation to the application of ESEM, the proposed cut-off scores for fit indices should be considered tentative. The models were compared using Akaike Information Criterion (AIC) and Sample Size Adjusted Bayesian Information Criterion (SSABIC). A model with smaller AIC and SSABIC values is considered more appropriate than others [21].
RESULTS
Factor analyses
Table 1 shows the fit indices for CFA and ESEM. As can be seen in Table 1, the CFI, TLI, and RMSEA values for the four-factor models indicated poor fit, and the SRMR value can be taken as acceptable fit (CFI=0.844; TLI=0.830; SRMR=0.080; RMSEA=0.093). For the six-factor CFA, the CFI, TLI, and RMSEA values indicated poor fit, and the SRMR indicated acceptable fit (CFI=0.930; TLI=0.922; SRMR=0.054; RMSEA=0.063). For the four-factor ESEM, the CFI, TLI, and RMSEA values indicated poor fit, and the SRMR value can be taken as acceptable fit (CFI=0.899; TLI=0.863; SRMR=0.035; RMSEA=0.084). For the six-factor ESEM, the TLI value indicated near acceptable fit, and the CFA, RMSEA, and SRMR indicated acceptable fit (CFI=0.968; TLI=0.948; SRMR=0.017; RMSEA=0.052). Based on the rules [21], the four-factor ESEM (AIC=41,395.397; SSABIC=41,608.061) fitted the data better than the four-factor CFA (AIC=42,045.719; SSABIC=42,163.050), as indicated by smaller AIC and SSABIC values. Also, the six-factor ESEM (AIC=40,520.188; SSABIC=40,795.183) fitted the data better than the six-factor CFA (AIC=40,909.024; SSABIC= 41,037.355), as indicated by smaller AIC and SSABIC values. These results suggest that the ESEM solution provided a more accurate description of the structure than did the CFA and six-factor models gave a more precise description of the data than did the four-factor models.

Goodness-of-fit from factor analyses
Table 2 and Figure 2 presents the standardized factor loadings of the six-factor models of the SUMS. A cut-off for factor loadings of 0.30 is adopted [22]. In the six-factor CFA, all 30 items exhibited salient (i.e., ≥0.30) loadings on their target factors. In the six-factor ESEM, all 30 items had salient loadings on their respective intended factors. Some of these items also exhibited statistically significant secondary loadings on other factors, but the secondary loadings were generally smaller than the primary loadings. With regard to the enhancement motive factor, five enhancement motive items (items 2, 8, 14, 20, and 26) had salient loadings on this factor. However, item 4 which had salient loadings on the intended coping motive factor loaded relatively weakly on the enhancement motive factor. Concerning the conformity motive factor, five conformity motive items (items 6, 12, 18, 24, and 30) had salient loadings on this factor. However, item 27 which had salient loadings on the intended social motive factor loaded relatively weakly on the conformity motive factor. Four factors (information, coping, social, and pastime motives) did not manifest any non-target items with loadings ≥0.30. In the ESEM analysis, six factors emerged that clearly match the six intended dimensions of the SUMS.

Parameter estimates for the CFA and ESEM solutions of the SUMS
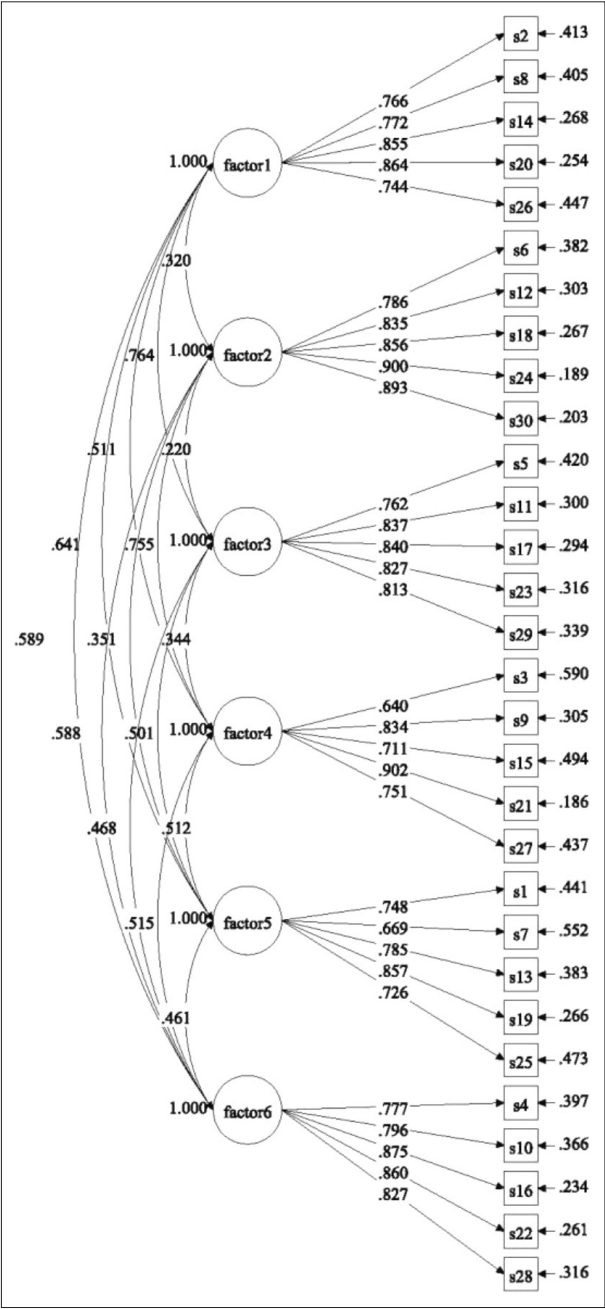
Confirmatory factor analysis (six factor model). All factor loadings are standardized and are statistically significant, p<0.001. Factor 1, enhancement motive; Factor 2, conformity motive; Factor 3, pastime motive; Factor 4, social motive; Factor 5, information motive; Factor 6, coping motive.
As can be seen in Table 3, the factor correlations were smaller in the ESEM analysis (M=0.40) than in the CFA model (M=0.50), retaining more factor distinctiveness in ESEM than in CFA. Considering the better fit obtained by the ESEM solution, the presence of significant cross-loadings, and the reduced factor correlations obtained by the ESEM analysis, the ESEM solution was considered to be superior to the CFA solution.

Correlations, descriptive statistics, and reliability
Convergent validity
Correlations between SNS use motives and SNS addiction are shown in Table 3. Convergent validity was assessed by examination of the correlation between the SUMS scores and self-reported SNS addiction scores. In ESEM, the correlations between the SUMS dimensions and the SNS addiction (enhancement: r=0.49, p<0.001; conformity: r=0.48, p<0.001; pastime: r=0.29, p<0.001; social: r=0.41, p<0.001; information: r=0.25, p<0.001; coping: r=0.57, p<0.001) were statistically significant (Table 3). In CFA, the correlations between the SUMS dimensions and the SNS addiction (enhancement: r=0.67, p<0.001; conformity: r=0.58, p<0.001; pastime: r=0.53, p< 0.001; social: r=0.60, p<0.001; information: r=0.45, p<0.001; coping: r=0.78, p<0.001) were also statistically significant (Table 3).
Reliability
The test of internal consistency produced a Cronbach’s alpha of 0.895 for the enhancement factor, of 0.931 for the conformity factor, of 0.908 for the pastime factor, of 0.877 for the social factor, of 0.868 for the information factor, and of 0.914 for the coping factor. All Cronbach’s alphas were higher than the recommended threshold level of 0.70 (Table 3). Test-retest reliability coefficients for a two-week interval were 0.737 for the enhancement factor, 0.831 for the conformity factor, 0.780 for the pastime factor, 0.759 for the social factor, 0.784 for the information factor, and 0.809 for the coping factor.
DISCUSSION
The aim of this study was to examine whether SUMS consists of four or six factors using CFA and ESEM approach. The results of the present study showed that the six-dimensional model yielded considerably better fit than the four-factor model. These findings support Shin and Lim’s [12] model of SNS use motives, suggesting that a six-factor model can best capture the structure of SNS use motives in this Korean sample. Also, the present study showed that, as expected, a better fit with the data was provided in ESEM than did in CFA. These findings are consistent with the previous studies comparing the performance of ESEM and CFA with measures of addiction [23] where the ESEM solution has shown to fit better than the CFA.
The current study showed that items of SUMS had small but significant, secondary loadings on factors other than the intended factor. Because cross-loadings were not constrained to zero in ESEM, the ESEM analyses were consistently found to provide better fit than CFA. These results could convince SNS addiction researchers to consider using ESEM when studying SNS use motives.
Given the presence of cross-loadings in the measurement model of use motives, simply relying on CFA and not using ESEM when investigating the factor structure of SNS use motives can lead to wrong conclusion. For example, poor-fitting CFA solutions may lead researchers to conclude that the sixfactor model cannot be adequate for the SNS use motives. Therefore, simply relying on CFA and not using ESEM can lead to a premature abandonment of otherwise promising theories in the field of SNS use motives and SNS addiction [16,17,23].
Another consequence of the exclusion of cross-loadings is inflated factor correlations. Previous studies with the addiction scales have shown that ESEM consistently results in smaller factor correlations than CFA [24,25]. Consistent with the previous studies, as shown in Table 3, the current study showed smaller factor correlations in ESEM than in CFA. These findings may support the resolution of concerns about the validity of six-factor model of SNS use motives. Being entirely dependent on CFA until recently, there were high correlations between the dimensions of SNS use motives. In particular, the correlation between pastime and enhancement motives was 0.80 in the previous CFA study [18]. Correlations greater than 0.70 were considered to indicate multicollinearity that could cause statistical problems [26]. However, the correlations found in this ESEM study among the dimensions of SNS use motives are lower than 0.70. For example, the strongest correlation found in the current ESEM analysis was 0.69, which was below the cut-off point for collinearity. Additionally, the four-factor models fit the data less well than the six-factor models, confirming that the SUMS reflects six interrelated but distinct factors. Thus, evidence generated from the ESEM solution supports the view that six dimensions of SNS use motives are distinguishable, and that no SNS use motive is redundant and that there is no need to exclude it for statistical reasons.
These results are not without limitations. First, this study is self-report study, which could be inflated by common method variance. Second, because the cross-sectional nature of the current study precludes any causal interpretation, studies using longitudinal designs are needed to identify a cause-and-effect relationship between SNS use motives and SNS addiction. Third, because the participants of this study were limited to college students and it was reported that the SNS usage rate in Korean 20s (91.9%) was the highest compared to other age groups [27], caution is required when applying the results of this study to the general public. Fourth, the measure for convergent validity used in the present study is different from that used in the Shin and Lim’s study [12]. The difference in the scale for convergent validity makes it difficult to compare the two studies, so it is necessary to replicate the results of this study using the scale used in the latter study in further studies. Fifth, because the researcher was with the participants in the classroom to answer the respondents’ questions in this study, the presence of the researcher may affect the honesty of the participants’ responses. Therefore, there is a need to devise a method in which the presence of the researcher does not affect the responses of the participants in the future study.
Despite these limitations, the results demonstrate Shin and Lim’s [12] six-factor model of SNS use motives and the factorial validity of the SUMS. ESEM performed better than CFA in terms of lower estimated inter-factor correlations and better fit indices. ESEM also uncovered cross-loadings which are not evident in CFA. The findings of the present study contribute to SNS addiction researchers by showing that the correlations between the six use motives are not strong enough to cause multicollinearity problems and to mislead statistical inference. As interest in research on SNS use motives increases, this study is expected to open a path for a more comprehensive conceptualization of SNS use motive.
Notes
Availability of Data and Material
The datasets generated or analyzed during the study are available from the corresponding author on reasonable request.
Conflicts of Interest
The author has no potential conflicts of interest to disclose.
Funding Statement
This research was supported by Daegu University Research Grant, 2018.