Analyzing Untreated Alcohol Use Disorder and Factors Related to Help-Seeking Status
Article information

Abstract
Objective
Alcohol use disorder (AUD) is a global burden but is also one of the most undertreated mental disorders. This study estimates the treatment rate (i.e., help-seeking status) of high-risk drinkers and factors associated with not receiving treatment in Korea using nationally representative National Health Insurance Service-National Sample Cohort (NHIS-NSC) data.
Methods
Among 1,025,340 participants, we eliminated those under 20 and those who did not respond to the question regarding alcohol consumption. High-risk drinkers were classified based on their frequency and quantity of alcohol consumption (4 or more drinks for women, 5 or more drinks for men per day on average). In total, 32,225 high-risk drinkers were checked for an actual AUD diagnosis to see their treatment-seeking status.
Results
Among 32,225 high-risk drinkers, only 1.24% had an AUD diagnosis, showing that over 98% of those who could be diagnosed with AUD are not seeking treatment. Factors associated with not seeking treatment were female sex, BMI higher or equal to 18.6, former smoker, middle-aged, and Charlson Comorbidity Index (CCI).
Conclusion
Our data show that many high-risk drinkers do not seek treatment in Korea. Experts, policymakers, and clinicians should promote help-seeking behavior for AUD and pay close attention to those at risk of not receiving treatment for AUD.
INTRODUCTION
Alcohol use disorder (AUD) is a global burden, with approximately 100 million estimated cases, the highest among all substance use disorders, as of 2016 [1]. Moreover, AUD contributes to about 4% of the global burden of disease [2]. Specifically, the 12-month prevalence estimate of AUD, among those age 15 or older in 2016, was 13.9% for Korea, which is much higher than that of the AUD of Western Pacific WHO-affiliated countries (4.7%) [3].
The effect of alcohol consumption on an individual’s health depends on the amount of alcohol consumption [4]. With low-dose consumption, there are possible beneficial effects, such as lowering the risk of ischemic stroke, sudden cardiac death, osteoporosis, diabetes mellitus, cancer, and obesity [4-6]. However, heavy alcohol consumption is associated with clear negative consequences: higher risk of diabetes [7], coronary and peripheral artery disease, stroke, hypertension, and so on [8]. Additionally, alcohol hangovers are associated with impaired cognitive functions [9], and current heavy alcohol consumption has lasting consequences on the individual’s cognitive function (e.g., learning, memory) [10]. Moreover, AUD is highly comorbid with other psychiatric disorders, and being comorbid with AUD further increases the risk of suicide mortality of individuals with a preceding psychiatric disorder [11].
Despite these detrimental effects of heavy alcohol consumption, AUD is undertreated [12]. Previous research studies indicate that less than a quarter of those who are eligible for AUD diagnosis, receives treatment [13,14]. A review study found that the treatment gap for alcohol abuse and alcohol dependence was the greatest among people with mental disorders: median 78.1% (ranging from 49.4%–96%) [15]. Considering the detrimental effects of AUD and its low treatment rate, it is important to find factors related to not seeking help and to provide appropriate interventions.
However, the majority of previous studies such as those by Cohen et al. [14] and Kessler et al. [16], only considered treatment utilization by actual patients and relied on the patient’s response to measure treatment utilization. It is important to investigate the characteristics of those who are eligible for AUD treatment but do not seek treatment, by using diagnostic records. Therefore, this study used a nationally representative cohort data to investigate treatment utilization (diagnosis record) of those with provisional AUD (including those with an AUD diagnosis and those who could be considered for an AUD diagnosis but did not seek treatment) and to explore the factors associated with not seeking treatment.
METHODS
Data source
South Korea achieved universal health coverage in 1989 through National Health Insurance (NHI). In 2000, NHI consolidated all related societies under a single payer, National Health Insurance Service (NHIS). Further, NHIS built a nationally representative database for research and policy development—the National Health Insurance Service-National Sample Cohort (NHIS-NSC). Participants from the national health insurance service-national sample cohort (NHIS-NSC) data (2002 to 2013) were included in the analysis. This study was approved by the Institutional Review Board (IRB) of the National Center for Mental Health, Ministry of Health and Welfare (116271-2020-01). Informed consent was waived since NHIS-NSC data is comprised of administrative data or they claim data which are routinely collected. The NHIS-NSC is comprised of 1,025,340 individuals, or 2% of the whole nation. To structure the database, 18 strata were built according to age group, sex, eligibility status, and income level; then, for each stratum, systematic sampling was done, maintaining the designated sampling rate (i.e., 2.2%). Additional information about NHIS-NSC can be found elsewhere [17].
Participants in the cohort were followed up for about 11 years, until 2013. Each year, there were inevitable dropouts due to death or emigration; to address this, about 9,000 infants aged 0 were newly added to the cohort. NHIS-NSC includes four databases (DBs). The qualification DB comprises the general information of health insurance subscribers and medicare recipients, such as sex, age, location, type of subscription, etc. The treatment DB is composed of information such as treatment and medication of the subjects. The medical check-up DB includes data regarding medical check-up as well as behavior and habitual data. Last, the clinic DB is composed of information on the clinic that subjects visit, such as equipment, type, location, etc. We identified those who could be considered for AUD through the medical check-up DB, which includes a self-questionnaire about the individual’s health behavior, including alcohol consumption. Help-seeking behavior was derived from the individual’s treatment DB. More details about the cohort can be found elsewhere [17].
Participant selection
Health checkups were included under the insurance benefits of the NHIS. There are three different types of checkups, categorized by age: infant, youth, and adult. The adult checkups include general screening, cancer screening, and health screening. Among various screening items, we utilized self-report about the participants’ lifestyle, specifically, alcohol consumption. Within the NHIS-NSC, those who were under 20 and those who did not give a response to the question regarding alcohol consumption were excluded from the analysis. Among those who remained, we categorized participants as “high-risk drinkers” or not, based on their frequency and quantity of alcohol consumption in the past month. For frequency, the question was “How often did you drink alcohol in the past month?” The responses options were 1) do not drink, 2) 2–3 times a month, 3) once or twice a week, 4) 3–4 times a week, 5) almost every day. The quantity of alcohol consumption was based on the following question: “On one occasion, how much alcohol do you usually drink?” The response options were 1) around half a bottle or less of soju or equivalent, 2) around one bottle of soju or equivalent, 3) around one and a half bottles of soju or equivalent, or 4) around more than two bottles of soju or equivalent (soju is the most popular Korean traditional liquor with about 20% alcohol content). The criteria for “high-risk drinkers” were based on previous literature: women who have 4 or more drinks per day and men who have 5 or more drinks per day on average [10,18]. One average soju bottle comprises 7 drinks. Ultimately, 32,225 participants were classified as “high-risk drinkers” and were included in the analysis (Figure 1). After classifying high-risk drinkers, we then checked whether they had received a diagnosis of AUD (F10) based on the ICD-10 code during the follow-up period. However, since we only considered the quantity and frequency of alcohol consumption and did not consider how alcohol consumption interferes with individual’s daily life (one of the diagnostic criteria in DSM-5), not all high-risk drinkers may actually have AUD.
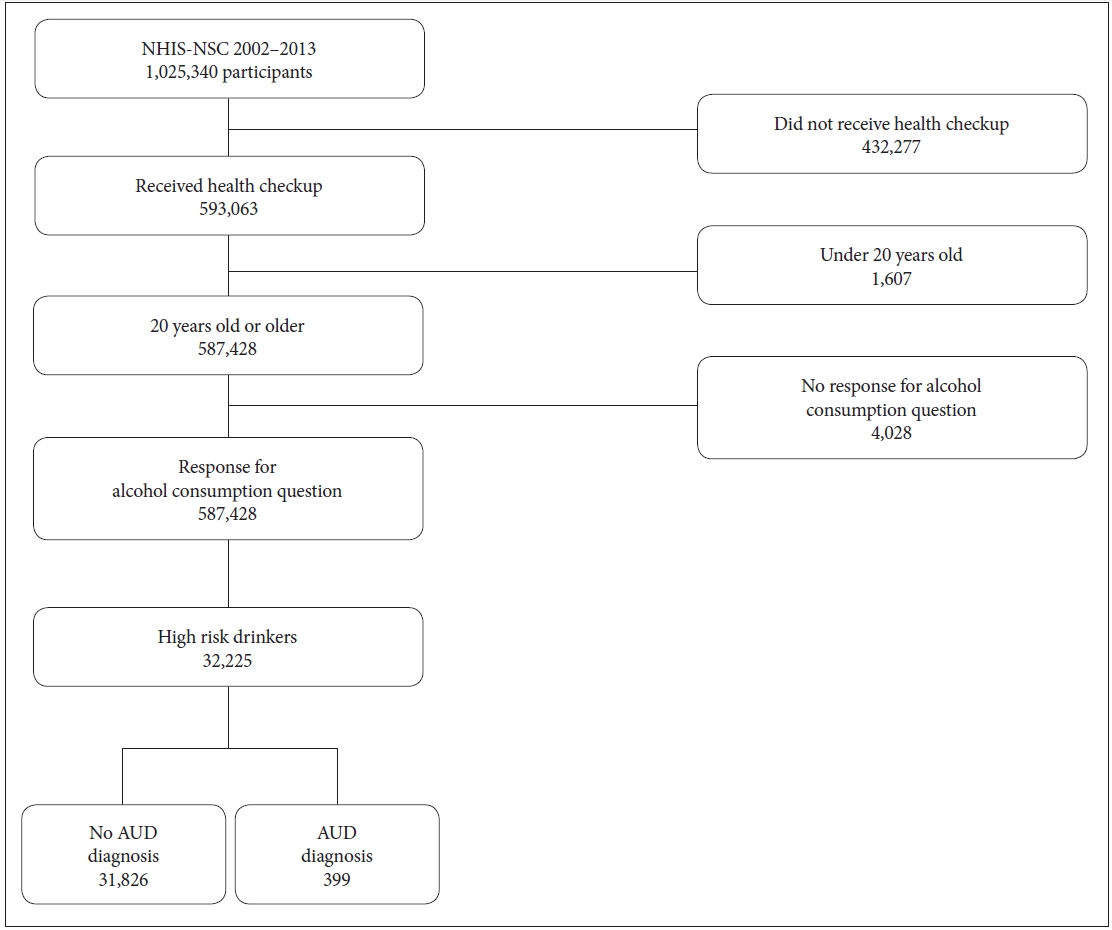
Participant selection process. AUD, alcohol use disorder.
Variables
We selected variables that could be related to AUD treatment status from the NHIS-NCS. For those who had received a diagnosis of AUD, we merged the most recent demographic and health check-up data preceding AUD diagnosis; for those without an AUD diagnosis, we utilized the latest health checkup data. The variables included in the analysis were as follows: sex, age, body mass index (BMI), current smoking status (never smoked, former smoker, current smoker), physical activity per week (none, 1–4 times, 5–7 times), income level (medical aid, low, middle, and high), Charlson Comorbidity Index (CCI), and diagnosis of hypertension or diabetes. Sex was determined based on how individuals were registered by the insurance system (i.e., male or female). Age was divided into three ranges: 20–39, 40–69, and 70 or older. Current smoking status and physical activity were self-rated by participants using the (respective) questions, “How much do you smoke?” and “How many times a week do you exercise to the point where you sweat?” Current smoking status was categorized based on the response choices of 1) never smoked, 2) smoked in the past but not anymore, and 3) smoke currently, while physical activity was determined through 1) never, 2) 1–2 times, 3) 3–4 times, 4) 5–6 times, and 5) almost every day. Income level was based on the participant’s contribution level (payment) to the NHI. Thus, higher the income, higher the contribution level, where a contribution level of 0 indicated the lowest income level (receiving medical aid beneficiaries), while 10 indicated highest income and contribution level. Therefore, contribution levels were classified as 0 (medical aid), 1–3 (low income), 4–6 (middle income), and 7–10 (high income). CCI categorizes the individual comorbid condition (which may influence mortality risk) [19]. Each condition (e.g., hypertension, acquired immune deficiency syndrome [AIDS]) has its own severity level, where 0 indicates no comorbid conditions and higher scores indicate multiple comorbid conditions that may increase the fatality risk. BMI, CCI, and diagnosis of hypertension and diabetes were derived or calculated from participants’ health records.
Statistical analysis
We classified participants as “high-risk drinkers” based on their responses regarding their drinking pattern (average drinks consumed per day for each participant). We then compared demographics, health management behavior, and comorbid physical disease data between the treatment-seeking group and the no-treatment-seeking group through chi-squared analysis. Multiple logistic regression was performed to investigate factors associated with patients not receiving treatment (diagnosis of AUD) even if those patients could qualify as having AUD. P-values of <0.01 were considered statistically significant. All statistical analyses were performed with SAS software version 9.4 (SAS Institute Inc., Cary, NC, USA).
RESULTS
This study has estimated the number of high-risk drinkers who have a high possibility of meeting the diagnostic criteria for AUD and their treatment rate. We also identified characteristics associated with not seeking treatment. As shown in Figure 1, there were 32,225 (about 5.5%) participants who could be considered high-risk drinkers. Among these individuals, only 399 (1.24%) were diagnosed as AUD, that is, 31,826 (98.76%) did not receive treatment. Table 1 shows the characteristics of participants based on AUD diagnosis status.

Participant characteristics
Table 2 shows the risk of not receiving treatment by sex, age group, BMI, smoking status, physical activity (per week), and CCI. Specifically, female sex (AOR=1.677, 95% CI=1.074, 2.618), BMI 18–22.9 (AOR=1.614, 95% CI=1.023, 2.546), BMI ≥23 (AOR=2.794, 95% CI=1.1771, 4.408), and being a former smoker (AOR=2.528, 95% CI=1.724, 3.708) were associated with higher risk of not receiving help for AUD, and being middle-aged (AOR=0.622, 95% CI=0.474, 0.815), having CCI of 2 (AOR=0.527, 95% CI=0.403, 0.690), and CCI ≥3 (AOR=0.436, 95% CI=0.323, 0.587) were associated with lower risk of not receiving help after adjusting for related variables.

Risk of not receiving treatment by sociodemographic variables, health behavior, and comorbid disease
DISCUSSION
Our findings indicated that 32,225 out of 587,428 participants (i.e., those who responded about alcohol consumption in the questionnaire) were classified as high-risk drinkers. This suggests that about 5.5% of them are high-risk drinkers, who could be considered to have AUD. This percentage is slightly higher than the one-year prevalence rate of 3.5% for AUD according to The Survey of Mental Disorders in Korea 2016 [20]. This study classifies individuals as ‘high-risk drinkers’ using two factors: frequency and quantity of alcohol consumption. In contrast, the Survey of Mental Disorders in Korea utilized the Korean version of the Composite International Diagnostic Interview [21], which applied full diagnostic criteria. This may explain the discord between the two studies’ prevalence rates.
Moreover, among 32,225 high-risk drinkers, only 399 have been diagnosed with AUD. This means that only 1.24% of high-risk drinkers have received treatment. This is broadly consistent with previous studies showing low treatment rates (i.e., less than 25%) for alcohol use disorders; 13 [22], however, at only 1.24% treated, the treatment gap in Korea seems to be much more problematic. There are several explanations for the low treatment rate of AUD in general. First of all, there is a tendency for drinkers to underestimate the amount they consume [23]. Another related factor is high stigma towards AUD: a previous study found that AUD patients with higher stigma towards AUD were less likely to seek help, meaning that stigma towards patients with AUD could interfere with patients’ help-seeking behavior [18]. Moreover, according to a recent review study, alcoholism can go into remission without formal treatment, which could explain the low treatment rate [24]. However, the same review study also states that formal treatment is still important, since it is impossible at this stage to predict who will or will not experience spontaneous remission.
In addition to the aforementioned explanations for the low treatment rate of AUD, the unique drinking culture of Korea could be a factor that reduces treatment rate. Typically, Koreans’ drinking behavior is characterized as “social drinking,” and when they drink, there is a culture where individuals take a “one-shot” drink of alcohol rather than a sip and then hand the empty glass over to the next person to take a “one-shot” [25]. This culture may lead individuals to drink more alcohol. In line with this, Korea has a tendency to be lenient towards alcohol consumption [26]. Furthermore, drinking alcohol is an important element not only in social gatherings but also in professionaly fields. Korean workers believe that alcohol is an important component in building and maintaining relationships with their coworkers [27]; as a consequence, the social costs associated with alcohol (loss of productivity, health care costs, etc.) account for about 2% of Korea’s GDP [28]. However, despite the consequences of risky drinking, alcohol consumption in Korea has been continuously increasing for the past 40 years [26]. It seems like alcohol consumption is an important means of maintaining social and work life in Korea and that Korean society’s lenient attitude towards alcohol consumption may blind individuals to the consequences of risky drinking behavior. The government, policymakers, and clinicians should put in more effort to decrease alcohol consumption and increase treatment utilization for people with AUD and high-risk drinkers.
There was a sex difference in help-seeking behavior for AUD, with women having a higher risk of not receiving help. This is in line with previous studies that have found that women are less likely than men to receive help for alcohol problems [29-31]. Furthermore, previous literature states that women have unique barriers to seeking treatment compared to men [32]: greater economic barriers and family responsibilities, stigma, and social disapproval [33,34]. This shows that there need to be sex-specific strategies when identifying those who need help with AUD.
Being a former smoker was associated with higher risk of not receiving help than never having smoked. There are concerns that smoking cessation leads to higher risk of other substance use [35]. However, according to a recent review study, smoking cessation was not associated with higher risk of other substance use; in fact, almost 50% of the studies showed solely positive effects of smoking cessation [36]. Furthermore, another recent study states that smoking cessation does not affect changes in alcohol consumption [37]. Rather, smoking cessation may be associated with stress levels: In our study, those who had successfully quit smoking had lower stress levels compared to those who did not attempt to quit smoking (OR=0.87, 95% CI=0.86–0.89). Moreover, those who attempted but failed to quit smoking had higher stress than those who did not attempt to quit (OR=1.11, 95% CI=1.09–1.14) [38]. Combining these results, it is possible to infer that smoking cessation may not be related to a person’s amount of alcohol consumption or other substance use problems, but that it might affect the individual’s psychological distress. Therefore, former smokers may not feel the need to receive help for AUD, since they might have lower levels of psychological distress.
BMI less than 18.6 was associated with receiving treatment for AUD. This suggests that high-risk drinkers who have a normal BMI or who are obese have a higher risk of not receiving help. According to a previous study, the relationship between BMI and mortality has a j-shaped relationship, suggesting that being underweight as well as overweight could be associated with mortality [39]. Moreover, the all-cause mortality was lowest among those with normal BMI (between 20 and 24.9). Therefore, those with normal BMI may not seek help, since they have the lowest risk of health conditions and mortality, while those with low BMI may seek treatment, since they have more complicated health issues. Moreover, previous research [40] indicates that higher BMI is associated with more perceived barriers in weight-loss treatment seeking and specifically with the stigma-related barrier (i.e., “I am afraid people will treat me unfairly or badly”); such a perceived stigma may have a negative impact on treatment-seeking for AUD as well as weight-loss treatment-seeking.
Respondents with more comorbid diseases had a lower risk of not receiving diagnosis for AUD (i.e., those with more comorbid diseases seek help more compared to those with less comorbid diseases). According to previous studies, those with risky drinking problems only seek treatment when they have substantial difficulties in their life [41,42]. This could be related to the fact that patients usually get diagnosed with AUD while being admitted for a physical disease (e.g., liver or gastrointestinal disease) [2]. Also, those with AUD have a high risk of having other, comorbid psychiatric disorders [43]. Therefore, an evaluation for AUD is necessary for those who visit the hospital for a mental illness or alcohol-related physical condition.
Middle-aged respondents showed lower risk of not seeking treatment for AUD compared to younger ones. This finding is in line with previous studies showing treatment-seeking behavior increasing with age [14,31,44,45]. For the younger age group, perceived stigma or fear that being diagnosed with a substance abuse disorder will negatively influence their career could limit them from seeking help [14]. More efforts to encourage help-seeking behavior in younger people are needed.
Despite the meaningful findings of this study, there are also several limitations. First, we defined high-risk drinkers (provisional AUD) based only on the participants’ frequency and quantity of alcohol consumption; that is, we did not consider how alcohol consumption affects each individual’s daily life functioning, which is another diagnostic criterion for AUD. Second, since we conducted a retrospective cohort study, there may have been some limitation on the data that we could utilize for the purpose of this study. Future studies need to conduct prospective cohort research to get a clearer view of the relationship between high-risk drinkers, help-seeking behavior, and related factors. Another limitation is that since the frequency and quantity of alcohol consumption were based on participants’ self-report, there may have been bias in their responses.
In conclusion, this study has estimated the treatment rate of those at high risk for AUD in Korea. Overall, the treatment rate of high-risk drinkers is quite low, and there need to be more efforts to emphasize the risks of heavy alcohol consumption. Moreover, we investigated the factors associated with not seeking treatment; efforts are needed to motivate individuals to seek treatment for AUD based on these factors. Researchers, policymakers, and related professionals should use this study to plan prevention and treatment efforts for AUD.
Notes
Availability of Data and Material
The datasets generated or analyzed during the current study are available in the National Health Insurance Sharing Service repository, [https://nhiss.nhis.or.kr/bd/ab/bdaba013eng.do].
Subin Park, a contributing editor of the Psychiatry Investigation, was not involved in the editorial evaluation or decision to publish this article. All remaining authors have declared no conflicts of interest.
Author Contributions
Conceptualization: all authors. Data curation: all authors. Formal analysis: MinKyung Jo. Methodology: MinKyung Jo, Subin Park. Writing—original draft: Soo Jung Rim. Writing—review and editing: Soo Jung Rim, Junghyun H. Lee, Subin Park. Approval of final manuscript: all authors.
Funding Statement
This work was supported by the National Center for Mental Health, Republic of Korea, under a clinical research grant [number 2020-01].