Effect of tDCS on Aberrant Functional Network Connectivity in Refractory Hallucinatory Schizophrenia: A Pilot Study
Article information
Abstract
We aim to investigate the effect of fronto-temporal transcranial direct current stimulation (tDCS) on the interactions among functional networks and its association with psychotic symptoms. In this pilot study, we will determine possible candidate functional networks and an adequate sample size for future research. Seven schizophrenia patients with treatment-refractory auditory hallucinations underwent tDCS twice daily for 5 days. Resting-state fMRI data and measures of the severity of psychotic symptoms were acquired at baseline and after completion of the tDCS sessions. At baseline, decreased functional network interaction was negatively correlated with increased hallucinatory behavior. After tDCS, the previously reduced functional network connectivity significantly increased. Our results showed that fronto-temporal tDCS could possibly remediate aberrant hallucination-related functional network interactions in patients with schizophrenia.
INTRODUCTION
Among psychotic symptoms, auditory hallucinations are frequently treatment-refractory and are observed in 25.30% of patients with schizophrenia [1]. As an alternative to ineffective medications, a movement to treat auditory hallucinations with transcranial direct current stimulation (tDCS), a form of neuromodulation therapy, has recently attracted attention. Controversy regarding the effectiveness of tDCS on auditory hallucinations in patients with schizophrenia was reported in early studies [2,3]. However, tDCS administered twice daily for 5 days over the left dorsolateral prefrontal cortex (DLPFC) (anode) and left temporo-parietal junction (TPJ) (cathode) was recently reported to improve auditory hallucination symptoms in patients with schizophrenia [3-6]; this relief was shown to result from modulation of the functional connectivity within the cathode-stimulated region, the left TPJ [6]. Recently, interaction anomalies among functional networks rather than focal fronto-temporal dysconnectivity [7] have been reported to be associated with the auditory hallucinations of schizophrenia patients [8], implying that auditory hallucinations can be better assessed by considering interactions between functional networks. We plan to explore the influence of tDCS on the interaction between the functional networks as well as how tDCS is associated with improvements in psychotic symptoms. In this pilot study, we aimed to explore possible candidate functional networks associated with tDCS and determine an adequate sample size for future research.
METHODS
Participants
Seven schizophrenia patients were enrolled in an open-label pilot study. Schizophrenia patients with treatment-refractory auditory hallucinations, including patients who had been treated with sufficient dosages of antipsychotic medications for at least 3 months, were enrolled through the outpatient clinic of the Seoul National University Hospital (SNUH). The participants’ medication status and clinical assessments are described Supplementary Material (in the online-only Data Supplement). Written informed consent was obtained from all participants after they had been completely informed of the scientific use of their medical data. This study was approved by the Institutional Review Board of SNUH and the Ministry of Food and Drug Safety of Korea. The present study was registered in ClinicalTrials.gov: Treatment of Refractory Auditory Verbal Hallucinations With tDCS in Schizophrenia; https://www.clinicaltrials.gov/show/NCT02451371.
tDCS procedure
tDCS was performed with a YDT-201N stimulator (www.ybrain.com, Seoul, South Korea) using saline-soaked sponge electrodes measuring 7×5 cm (35 cm2) on the scalp; a 2-mA stimulus was administered for 20 minutes per session. Both the anodal and cathodal electrodes were placed according to the international 10–20 system: the anode electrode was placed between the F3 and FP1 electrode sites (the left DLPFC), and the cathode electrode was placed between T3 and P3 (the left TPJ). Each patient received two sessions daily (separated by a minimum 3-hour interval) for 5 consecutive weekdays, and each patient completed a total of 10 stimulation sessions and reported no side effects, such as itching, redness, or an initial burning sensation.
Image processing
Supplementary Material (in the online-only Data Supplement) for a detailed description of image acquisition. The first 4 volume images of the rest scan were discarded. Therefore, the 240 remaining functional images were preprocessed using the Statistical Parametric Mapping software package, version 12 (SPM12, (www.fil.ion.ucl.ac.uk/spm), Wellcome Department of Cognitive Neurology, London, UK). First, the functional images were processed with slice timing correction and subsequently realigned to correct for head motion. None of the scans exceeded our head motion criteria (translation >2 mm and rotation >2° in any direction). After realignment, the functional volumes were co-registered to each participant’s structural volume. Each image was segmented into gray matter, white matter, and cerebrospinal fluid and then spatially normalized to the standardized Montreal Neurology Institute (MNI) space (http://www.mni.mcgill.ca/). The normalized functional volume was resampled to a voxel size of 3×3×3 mm3 and spatially smoothed with a 6×6×6-mm full width at half maximum (FWHM) isotropic Gaussian kernel.
Extraction of components
Temporally distinct resting-state components were extracted from the preprocessed functional data using an independent component analysis (ICA) software package, the Group ICA of fMRI Toolbox (GIFT, version 3.0a; http://mialab.mrn.org/software/gift/). According to the minimum description length criteria, 34 spatially independent components were extracted [9]. The functional data for each participant were initially reduced via principal component analysis. Then, an independent component estimation was performed using the Infomax algorithm [10], and the procedure was repeated 20 times in ICASSO for stability of the decomposition [11]. A complete description of the component extraction procedure is presented in a study by Calhoun et al. [12] The left executive control network (ECN) (Figure 1A, Supplementary Table 1 in the online-only Data Supplement) and auditory network (Figure 1B, Supplementary Table 2 in the online-only Data Supplement) were identified using in-house code [13].

Maps of the networks of interest, the association between functional network connectivity and symptom severity, and the change in functional connectivity after 10 transcranial direct current stimulation (tDCS) sessions. (A) The left executive control network (ECN), (B) the auditory network, (C) the association between functional network connectivity and hallucinatory symptom severity at baseline, and (D) the changes in functional network connectivity. Both displayed networks, the left ECN and auditory network, were extracted with independent component analysis and had a threshold of Z >3. All correlation coefficient values of functional network connectivity are Fisher’s Z-transformed.
Functional network connectivity analysis
With the Functional Network Connectivity (FNC) toolbox [14], ICA time course data were bandpass-filtered with a Butterworth filter at cutoff frequencies of 0.01 to 0.15 Hz. The maximal lagged correlation (-3 to +3 seconds) was examined between the selected functional networks (i.e., the left ECN and auditory network). Therefore, we were able to acquire 1 functional network connectivity value between the left ECN and the auditory network in each participant. The Fisher transformation was used to transform the results to a Z-score for further statistical analysis. The effects of tDCS on the functional connection between the auditory network and left ECN and on clinical symptoms were tested for significance by non-parametric analysis, the Wilcoxon singed-rank test. The associations between functional network connectivity and clinical symptom scores and between changes in functional network connectivity and changes in clinical symptom scores were assessed by Spearman’s correlation analysis.
RESULTS
The demographic characteristics of the participants are summarized (Table 1). After 10 tDCS sessions, significant improvements in the PANSS total (p=0.027) and general symptom (p=0.027) scores were observed (Table 2, Supplementary Figure 1 in the online-only Data Supplement). There were no statistically significant differences between the auditory hallucination symptoms before and after tDCS, despite the fact that there was a decrease in the hallucinatory behavior subscale score of the PANSS (p=0.102). At baseline, the functional network connection between the auditory network and the left ECN was negatively correlated with the score for the hallucinatory behavior subscale of the Positive and Negative Syndrome Scale (PANSS) (R=-0.756, p=0.049) (Figure 1C). The functional network connection between the left ECN and auditory network was significantly increased (Z= -2.028, p=0.043) (Figure 1D).

Demographic characteristics
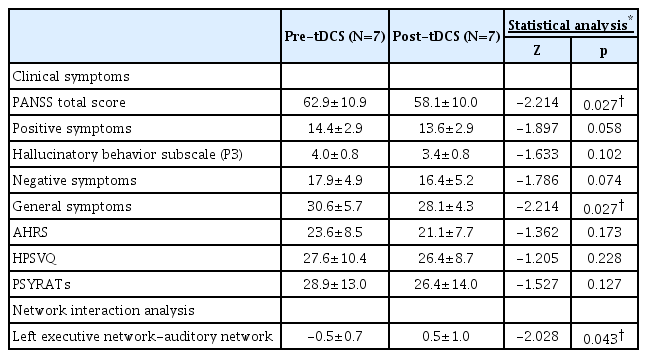
Changes in clinical symptoms and functional network interactions observed after patients completed transcranial direct current stimulation (tDCS)
DISCUSSION
The results of this pilot study suggest evidence of tDCS restoring interactions at the brain network level. Before the tDCS sessions, the functional network connectivity between the left ECN and auditory network was negatively correlated with the severity of the hallucinatory symptoms. After 10 tDCS sessions, the previously decreased interaction was significantly increased, which is consistent with a previous study reporting enhanced interactions between functional networks after electroconvulsive therapy in patients with major depressive disorder [15].
This study has several limitations. First, since this study was a pilot study, a limited number of participants were included; therefore, our results should be interpreted with caution. Nevertheless, all measures of psychotic symptom severity, including auditory hallucinations, showed decreasing trends after tDCS, and based on our findings, we anticipate that future studies with larger sample sizes will observe significant alleviation of the severity of auditory hallucinations and its association with changes in functional network interactions. Second, our study was an open-label study without a sham control, which makes interpretation of the effects difficult. Therefore, we cannot easily conclude that the changes observed in the present study were purely attributed to tDCS. However, the restingstate functional connectivity findings have been reported to be an involuntary physiological process that may compensate for this limitation [16].
Our findings suggest a mechanism by which fronto-temporal tDCS promotes the remediation of fronto-temporal alterations in patients with schizophrenia. Rather than enhance connectivity in specific brain regions, tDCS improves the interaction between the left ECN and auditory network. Our findings provide additional support for the recently proposed hypothesis that auditory hallucinations in schizophrenia are caused by an abnormal interaction between brain functional networks [8]. However, a limited number of participants were included in this pilot study, and our results should be confirmed by a sham-controlled clinical trial with an adequate number of participants. Efforts have been directed toward understanding the underlying mechanism of tDCS by investigating its influence on brain physiology [17-19], and in future studies, various efforts to understand brain modulation with regard to tDCS can provide data to determine the most appropriate tDCS procedures to treat specific psychiatric symptoms.
Supplementary Materials
The online-only Data Supplement is available with this article at https://doi.org/10.30773/pi.2018.11.18.
Acknowledgements
This work was supported by grants from the National Research Foundation of Korea (NRF) funded by the Ministry of Science, ICT and Future Planning (Basic Science Research Program, Grant No. NRF-2015R1C1A1A01053988 and Brain Research Program, Grant No. 2017M3C7A1029610).