


INTRODUCTION
The global population of AlzheimerŌĆÖs disease (AD) patients is about 35 million people and expected to be 115.3 million people in 2050 [1]. Pathognomonic findings in pathologies of AD are characterized by amyloid plaque and neurofibrillary tangles, consisting of abnormal accumulation of beta-amyloid (A╬▓) protein and tau proteins, respectively, in the brain. These two abnormal proteins accumulate about 15 years before onset of symptoms including complaints of cognitive decline. Given that there are no disease modifying treatments in AD, it is important to assess the risk of AD and detect the disease at the early stage [2].
AD has been diagnosed based on clinical diagnostic criteria in most clinical practice. However, the diagnostic method in AD based on clinical diagnostic criteria has limitations, showing low sensitivity (71% to 81%) and specificity (about 70%), since confirmation of AD is based on the histopathologic findings [3]. Cerebrospinal fluid (CSF) A╬▓ examination is a useful, low-cost fluid biomarker for cerebral amyloid A╬▓ pathology. However, is use in clinics is limited because the test is not only invasive, but also inapplicable in patients with increased intracranial pressure, coagulopathy, or current use of anticoagulant. As amyloid positron emission tomography (PET), non-invasive imaging marker of A╬▓ in the brain, has been developed, it is possible to confirm AD without post-mortem autopsy [4]. However, its accessibility is low in the real clinical settings due to high cost.
In 2013, the AlzheimerŌĆÖs Association and the Society of Nuclear Medicine and Molecular Imaging convened the Amyloid Imaging Taskforce to gather empirical evidence to support the clinical utility of amyloid imaging. Patients who have persistent unexplained mild cognitive impairment (MCI), patients with atypical presentations of AD, and patients who develop progressive neurocognitive disorder (NCD) symptoms at an atypically early age are more likely to benefit from amyloid imaging [5]. However, when we apply the guideline in a memory clinic, more specific guidelines, including demographics or genetics, for conducting amyloid PET are needed. Although several previous studies have made prediction models for cerebral amyloid positivity, there were limitations in applying clinically unavailable variables to the model or creating a model for one disorder such as MCI or AD. We aimed to develop amyloid prediction models in subjects with varying cognitive status using various clinical data routinely obtained in a regular clinical practice. We will develop three models: one for all subjects suffering from cognitive decline, one for MCI subjects, and one for AD dementia subjects. In addition, we aimed to assess the performance pf amyloid prediction models.
METHODS
Study population
A total of 410 patients with various diagnosis, 410 participants with MCI or AD were enrolled in this study from a cohort of cognitive impairment in the Seoul St. MaryŌĆÖs Hospital, Catholic Medical Center. This study included participants who underwent both amyloid PET and apolipoprotein ╬Ą (APOE) genotyping from January 2016 to January 2019.
Diagnostic assessments
Detailed history taking, comprehensive physical examinations, including body weight, height, and blood pressure (BP), laboratory tests, and brain imaging, such as magnetic resonance imaging (MRI), or computed tomography (CT), were performed in all of the subjects. With regard to clinical history, age, sex, years of education, family history of dementia, and past medical history, including diabetes mellitus (DM), hypertension (HTN) were collected. Body mass index (BMI) was calculated by the body weight divided by the square of the body height. To exclude other causes of cognitive impairment, a thyroid function test (thyroid stimulating hormone), lipid profile (total cholesterol), and vitamin B12 were assessed using blood. APOE genotype was determined by PCR using blood samples in EDTA tubes. Subjects with at least one ╬Ą4 allele were classified as APOE4 positive. Mini mental state examination (MMSE) and sum of the box score for clinical dementia rating (CDR-SB) were used to assess global cognition in all participants. In addition, a neuropsychological battery such as the Seoul Neuropsychological Screening Battery (SNSB) [6] or the Korean version of the Consortium to Establish a Registry for AlzheimerŌĆÖs Disease (CERAD-K) [7] was used for assessment of multiple cognitive function.
Amyloid PET/CT scan
Amyloid PET/CT scans were performed on a Discovery PET/CT 710 (GE Medical Systems, Milwaukee, WI, USA) or a Biograph TruePoint 40 PET/CT (Siemens Medical Solutions USA, Knoxville, TN, USA). Here, 18F-florbetaben and 18F-flutemetamol were used as 18F-labeled A╬▓ targeting tracers. Patients received an intravenous injection of 8.0 mCi of 18F-florbetaben or 5.0 mCi of 18F-flutemetamol and rested in a waiting room. Image acquisition started approximately 90 minutes after the injection, with a scan duration of 20 minutes.
The 18F-florbetaben PET and flutemetamol PET scans were visually rated as either amyloid-positive or amyloid-negative by the trained nuclear medicine physician. Interpretation of the 18F-florbetaben PET images was achieved by visually comparing the activity in the cortical gray matter with the activity in the adjacent cortical white matter. Brain regions of theŌĆölateral temporal cortex, frontal cortex, posterior cingulate cortex/precuneus, and parietal cortexŌĆöshould be systematically and cortical tracer uptake at any of the cortical target regions, while a negative scan indicates good grey-white matter contrast, with no tracer uptake at target regions [15]. The regions of interest of 18F-flutemetamol PET scans were the frontal lobe, posterior cingulate cortex/precuneus, lateral temporal lobe, parietal lobe, and striatum. Negative scans show more radioactivity in white matter than in grey matter, creating clear grey-white matter contrast. Positive scans show at least one cortical region with reduction or loss of the normally distinct grey-white matter contrast [16].
Development of cerebral amyloid prediction models
The following variables were used for developing amyloid prediction models; age, sex, years of education, BMI, family history of dementia, history of hypertension or DM, MMSE, CDR-SB, APOE4 genotype, total cholesterol, TSH, vitamin B12, blood pressure and clinical diagnosis. These variables were included because they are well-known risk factors for dementia.
Statistical analysis
Continuous variables, including age, education (years), BMI, the MMSE, the CDR-SB, systolic and diastolic BP, TSH, total cholesterol, and vitamin B12, are presented with the mean and standard error (SE). Independent t-test was used to compare subjects with amyloid deposition and those without amyloid deposition. Categorical variables, including sex, family history of dementia, DM, HTN, APOE genotype, and clinical diagnosis, are presented with number and percentage. Chi-square test was used to compare between group with amyloid deposition and group without amyloid deposition. p value<0.05 was considered as statistically significant.
Through multivariate logistic regression analysis using a forward conditional method, we developed final models for cerebral amyloid positivity prediction. Age, sex, and year of education were entered as fixed variables. Sex, the categorical variable, was coded as 1 for male and 2 for female. Other variables were sequentially entered into the model using the forward likelihood ratio (LR) method. Odds ratios (ORs) and 95% confidence interval (CIs) were used to identify associations between clinical variables and amyloid positivity. We developed three cerebral amyloid prediction models according to cognitive status for all subjects, MCI subjects, and AD dementia subjects. The discriminative power of the cerebral amyloid prediction models was assessed using receiver operating characteristic (ROC) curve analysis and the area under the curve (AUC) values. Also, we produced simple models for cerebral amyloid prediction using logistic regression that included age, sex, years of education, and one of the other variables in the final model to compare the final models with each of the simple models. Additionally, we explored how the Youden index, sensitivity, specificity, positive predictive value (PPV), and negative predictive value (NPV) increases from 0.1 to 0.9 by 0.1 unit and presented the optimal cutoff point for probability for being amyloid positive (Supplementary Tables 1-3 in the online-only Data Supplement). All statistical analyses were performed using SAS version 9.2 (SAS Institute Inc., Cary, NC, USA).
RESULTS
Demographic characteristics
The characteristics of the 410 subjects according to amyloid positivity are summarized in Table 1. The proportion of amyloid PET-negative patients was 45.9% (n=188), while there were 54.1% (n=222) amyloid PET-positive patients. The patient diagnoses were 297 MCI, 113 AD dementia. The amyloid PET-positive patients were older than amyloid PET-negative patients. The amyloid PET-positive group contained 70.3% females, while the amyloid PET-negative group was 61.2% females. BMI was lower in the amyloid PET-positive group than in the amyloid PET-negative group. In the amyloid PET-positive group, 53.6% of patients were APOE4-positive, while 17.0% of the patients in the amyloid PET-negative group were APOE4-positive. The patients in the amyloid PET-positive group had lower cognitive function than the patients in the amyloid PET negative group, which was shown by lower MMSE and higher CDR-SB score in the amyloid PET-positive group. In blood chemistry, total cholesterol was higher in the amyloid PET-positive group than in the amyloid PET-negative group.
Cerebral amyloid prediction models in all subjects, MCI subjects, and AD dementia subjects
We developed three final models using multivariate logistic regression analysis in all subjects, MCI subjects, and AD dementia subjects.
P=probability for being cerebral amyloid positive
Pcase=(exp [Logitcase])/(1+exp [Logitcase])
Logitall=╬▓0+╬▓1 (age)+╬▓2 (sex)+╬▓3 (years of education)+╬▓4 (APOE4 positivity)+╬▓5 (MMSE score) (╬▓0=0.158, ╬▓1=0.029, ╬▓2=0.247, ╬▓3=0.034, ╬▓4=1.937, ╬▓5=-0.155)
LogitMCI=╬▓0+╬▓1 (age)+╬▓2 (sex)+╬▓3 (years of education)+╬▓4 (APOE4 positivity) (╬▓0=-3.668, ╬▓1=0.037, ╬▓2=-0.016, ╬▓3=0.004, ╬▓4=1.915)
LogitAD=╬▓0+╬▓1 (age)+╬▓2 (sex)+╬▓3 (years of education)+╬▓4 (APOE4 positivity)+╬▓5 (MMSE score)+╬▓6 (history of hypertension) (╬▓0=-0.012, ╬▓1=0.039, ╬▓2=1.043, ╬▓3=0.075, ╬▓4=2.631, ╬▓5=-0.198, ╬▓6=-1.615)
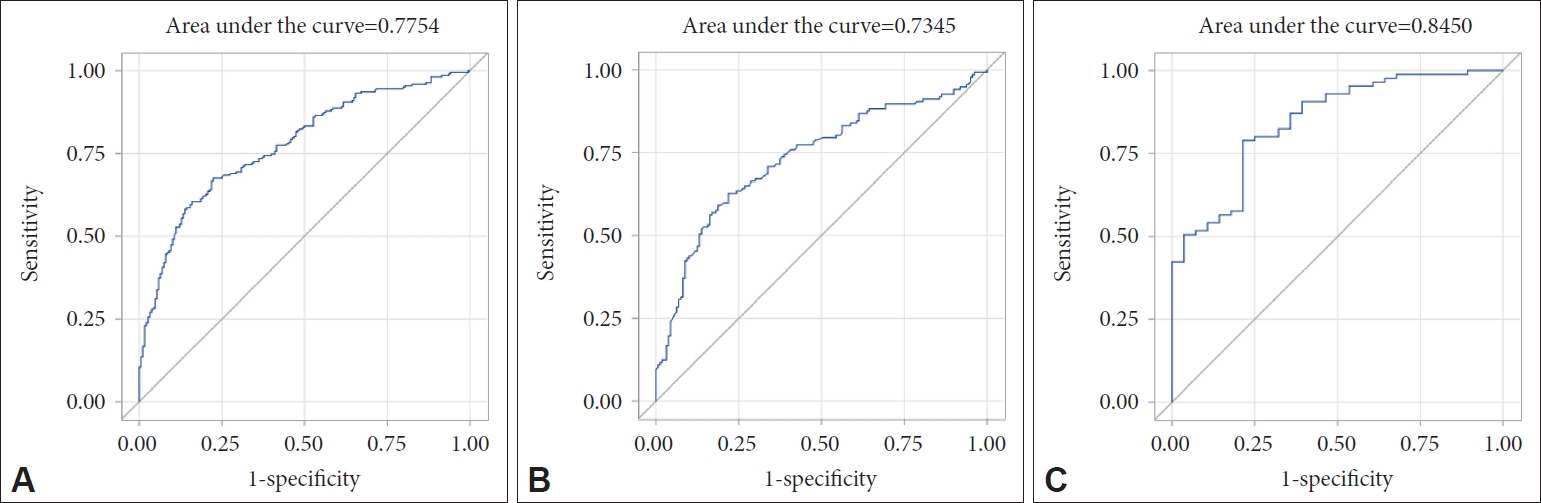
The first model was to predict cerebral amyloid positivity for all subjects with subjective cognitive decline in our memory clinic. Age, sex, years of education, BMI, APOE4, and MMSE score were selected for the final model for all subjects (Table 2). The AUC value of the ROC curve for the developed model was 0.775 (95% confidence interval [CI]=0.731 to 0.820) (Figure 1). The second model was to predict cerebral amyloid positivity for MCI subjects. Age, sex, years of education, BMI, and APOE4 were selected for the final model for MCI subjects (Table 3). The AUC value of the ROC curve for the developed model was 0.735 (95% CI=0.676 to 0.793) (Figure 1). The third model was to predict cerebral amyloid positivity for AD subjects. Age, sex, years of education, BMI, APOE4, MMSE score, and history of hypertension were selected for the final model for AD subjects (Table 4). The AUC value of the ROC curve for the developed model was 0.845 (95% CI=0.765 to 0.925) (Figure 1). We created simple models for cerebral amyloid prediction that included age, sex, years of education, and BMI as fixed variables and one of the other variables in the final model (APOE4, and MMSE in the all subjects model, and APOE4, MMSE, and history of hypertension in the AD dementia model) to compare the final models and each of the simple models (Tables 2 and 4). The AUC value for the all subjects model was 0.730 for the APOE4-only model, and 0.663 for the MMSE-only model. The AUC value for the AD dementia model was 0.747 for the APOE4-only model, 0.710 for the MMSE-only model, and 0.724 for the hypertension-only model. Statistical comparisons of the AUC values between the final models and each of the simple models show that the final model had a significantly larger AUC value than any simple model (Table 5).
DISCUSSION
The major findings of the present study were as follows. First, we found that older age, female sex, lower BMI, APOE4 genotype, lower MMSE score, higher CDR-SB score, and elevated blood total cholesterol independently predicted cerebral amyloid positivity in all subjects. Second, we developed models to predict the risk of cerebral amyloid positivity in all subjects, MCI subjects, and AD dementia subjects. Additionally we found superiority of ability to predict amyloid positivity by comparing final models and simple models.
Several previous studies have made prediction models for cerebral amyloid positivity. Bahar-Fuchs et al. [17] focused on neuropsychological tests, and they reported that episodic memory impairment was related to cerebral amyloid positivity in 45 MCI patients. Also, several prediction models focused on blood-based biomarkers have been reported [18-21]. Among these studies, three used plasma A╬▓ for predicting cerebral amyloid deposits [19-21]. Unfortunately, the blood-based biomarkers presented in these studies are limited because they are not commonly used in clinical practice. Haghighi et al. [22] developed a cerebral amyloid prediction model by integrating neuropsychological tests and plasma-based biomarkers in 168 MCI and 50 cognitively normal subjects. However, the study also included blood-based biomarkers that are not routinely available in clinical practice. Lee et al. [23] proposed a cerebral amyloid prediction model using commonly available clinical information on age, sex, years of education, APOE4, history of hypertension, and word list recall test score in 107 MCI and 69 early AD dementia patients for the KBASE cohort, and in 332 MCI and 144 AD dementia patients for the ADNI-2 cohort. In contrast, we developed three models: one for all subjects suffering from cognitive decline, one for MCI subjects, and one for AD dementia subjects. Also, our study included blood tests, and neuropsychological measurements of the MMSE and CDR-SB, which are commonly used during dementia evaluations in clinical practice. Therefore, our models make it possible to easily predict cerebral amyloid positivity using data obtained by routinely in clinical settings. Also, each model could be applied according to cognitive level.
In the models we developed, the AUC values were 0.775 for all subjects, 0.735 for MCI subjects, and 0.845 for AD dementia subjects. This means that the models can predict the positive rates of cerebral amyloid PET in 77.5%, 73.5%, and 84.5%, respectively. The all subjects model was applied to patients whose objective cognitive function level was not identified. The possibility of amyloid PET positivity was 77.5% in the subjects who were elderly, female, and had a low MMSE score, and had the APOE4 gene. The MCI model was applied to patients diagnosed with MCI. The possibility of amyloid PET positivity was 73.5% in subjects who were elderly, and had the APOE4 gene. These patients may need to undergo an amyloid PET or prepare for an early preventive intervention. In addition, the AD model was applied to patients probable AD dementia by NIA-AA diagnostic guideline. The possibility of amyloid PET positivity was 84.5% in subjects who were elderly, had low MMSE score, the APOE4 gene, and no history of hypertension. This result can help us develop additional diagnostic or therapeutic plans.
In the present study, APOE4 status was repeatedly associated with cerebral amyloid positivity in the three models for all subjects, MCI subjects, and AD dementia subjects. Inheritance of the ╬Ą4 allele of the APOE gene is the strongest genetic risk factor for AD. The interaction between APOE and A╬▓ plays a key role in AD pathogenesis. Previous studies revealed that the APOE-A╬▓ interaction regulates A╬▓ aggregation and clearance and therefore directly influences development of amyloid plaques, congophilic amyloid angiopathy, and the subsequent tau-related pathology [24]. We found that the APOE4 gene had the strongest association with cerebral amyloid positivity among all variables. Therefore, since it is possible for patients with the APOE4 gene to accumulate cerebral A╬▓, it is necessary to implement amyloid PET early or to establish a therapeutic intervention for all levels of cognitive function. MMSE scores were included in the final models for all subjects and for AD dementia subjects. The MMSE test is one of the simplest and most widely used screening tests for patients complaining of cognitive decline. We found that a lower MMSE score is a predictor for cerebral amyloid positivity in all subjects and in AD dementia subjects. History of hypertension was negatively correlated with cerebral amyloid positivity in AD dementia subjects. Demented individuals with a hypertension were less likely to be cerebral amyloid deposits than those without a hypertension. Since chronic hypertension can reduce brain reserve through overall or regional brain atrophy [25-28], individuals with a hypertension are more likely to be cognitively impaired with a relatively lower amyloid accumulation. Although APOE4, MMSE score, and history of hypertension were each significantly related to cerebral amyloid positivity, the final model with all three variables showed a superior screening ability compared to the simper models with only one variable in AD dementia subjects.
This study has several limitations. First, although our study included patients with vascular dementia, Lewy body dementia, frontotemporal dementia, and other types of dementia, we could not develop models to predict cerebral amyloid positivity for each type of dementia due to the small number of subjects. Second, it is possible that clinicians have applied amyloid PET to patients who are likely to be cerebral amyloid-positive. Third, since the same neuropsychological battery such as SNSB or CERAD-K was not applied uniformly, we could not include it in the analysis except for MMSE and CDR-SB results. Fourth, two types of 18F-labeled amyloid-╬▓ targeting tracers were applied to the study subjects, but these were not considered when developing the models. Nevertheless, this is the first study to developed three cerebral amyloid prediction models according to the level of cognitive function by integrating clinically obtained demographic, hematologic, and neuropsychiatric tests data.
In conclusion, we developed cerebral amyloid prediction models with variables that are routinely collected in clinical practice for subjects complaining of cognitive decline. This study demonstrated that integration of demographic variables, neuropsychological measurements, and blood-based markers significantly improved prediction accuracy. Furthermore, our developed models have the potential to be widely used as screening tools, because we created cerebral amyloid prediction models with data obtained routinely in clinical settings. We hope that early prediction of cerebral amyloid positivity through data commonly used in a memory clinic, will be helpful for screening cognitively impaired patients with high probability of cerebral amyloid deposition.